meshgrid
mesh[mɛʃ] 篩孔, 網線
numpy 的 meshgrid 是一個很好用的功能,可以產生每列 x 軸的座標及每行 y 軸的座標。
import numpy as np
a = range(5)
b = range(5)
x,y = np.meshgrid(a, b)
print("每列 x 的座標")
print(x)
print("每列 y 的座標")
print(y)
結果:
每列 x 的座標
[[0 1 2 3 4]
 [0 1 2 3 4]
 [0 1 2 3 4]
 [0 1 2 3 4]
 [0 1 2 3 4]]
每列 y 的座標
[[0 0 0 0 0]
 [1 1 1 1 1]
 [2 2 2 2 2]
 [3 3 3 3 3]
 [4 4 4 4 4]]
上述不論是 x 軸或 y 軸,都是[1,n] 的二維陣列。
標示座標
如果要標示每行每列的座標,代碼如下
import numpy as np
a = range(5)
b = range(5)
x,y = np.meshgrid(a, b)
for row in zip(x, y):
    for col in  zip(row[0], row[1]):
        print(col, end='')
    print()
結果:
(0, 0)(1, 0)(2, 0)(3, 0)(4, 0)
(0, 1)(1, 1)(2, 1)(3, 1)(4, 1)
(0, 2)(1, 2)(2, 2)(3, 2)(4, 2)
(0, 3)(1, 3)(2, 3)(3, 3)(4, 3)
(0, 4)(1, 4)(2, 4)(3, 4)(4, 4)
傳統思維產生格點
如果要在二維平面上產生格點如下圖

傳統思維的代碼如下
import pylab as plt
for x in range(20):
    for y in range(20):
        plt.scatter(x,y, s=0.5, c='b')
plt.show()
plt.scatter
plt.scatter(x, y) 其中的 x 是 x 軸的集合,y 是 y 軸的集合,代碼如下
import pylab as plt
x=[0, 1, 2, 3, 4, 0, 1, 2, 3, 4, 0, 1, 2, 3, 4, 0, 1, 2, 3, 4, 0, 1, 2, 3, 4]
y=[0, 0, 0, 0, 0, 1, 1, 1, 1, 1, 2, 2, 2, 2, 2, 3, 3, 3, 3, 3, 4, 4, 4, 4, 4]
plt.scatter(x,y,c='b')
plt.show()
上面藍色的 x, y 值,光 5*5 就打到快骨折,那麼如果是 20*20 的話,不就沒完沒了
meshgrid 產生 x , y 集合
把 meshgrid 產生的 x, y,由 [1,n] 的二維陣列轉成一維陣列 (x.reshape(-1)),再放入 plt.scatter(x, y) 就完成了。
import numpy as np
import pylab as plt
a = range(5)
b = range(5)
x, y = np.meshgrid(a, b)
x = x.reshape(-1)
y = y.reshape(-1)
print(x)
print(y)
plt.scatter(x, y, s=0.5)
plt.show()
結果:
[0 1 2 3 4 0 1 2 3 4 0 1 2 3 4 0 1 2 3 4 0 1 2 3 4]
[0 0 0 0 0 1 1 1 1 1 2 2 2 2 2 3 3 3 3 3 4 4 4 4 4]
plt 自動將二維轉成一維
上述的 x=x.reshape(-1) 其實是多餘的,因為 plt 會自動將多維扁平化成一維,所以只需如下代碼即可。
import numpy as np
import pylab as plt
a = range(5)
b = range(5)
x,y = np.meshgrid(a, b)
plt.scatter(x,y, s=0.5)
plt.show()
總結
meshgrid 的主要目的並不是要產生 (x, y) 的配對,而是要產生 x 軸的 list 及 y 軸的 list,方便傳給 plt.plot()
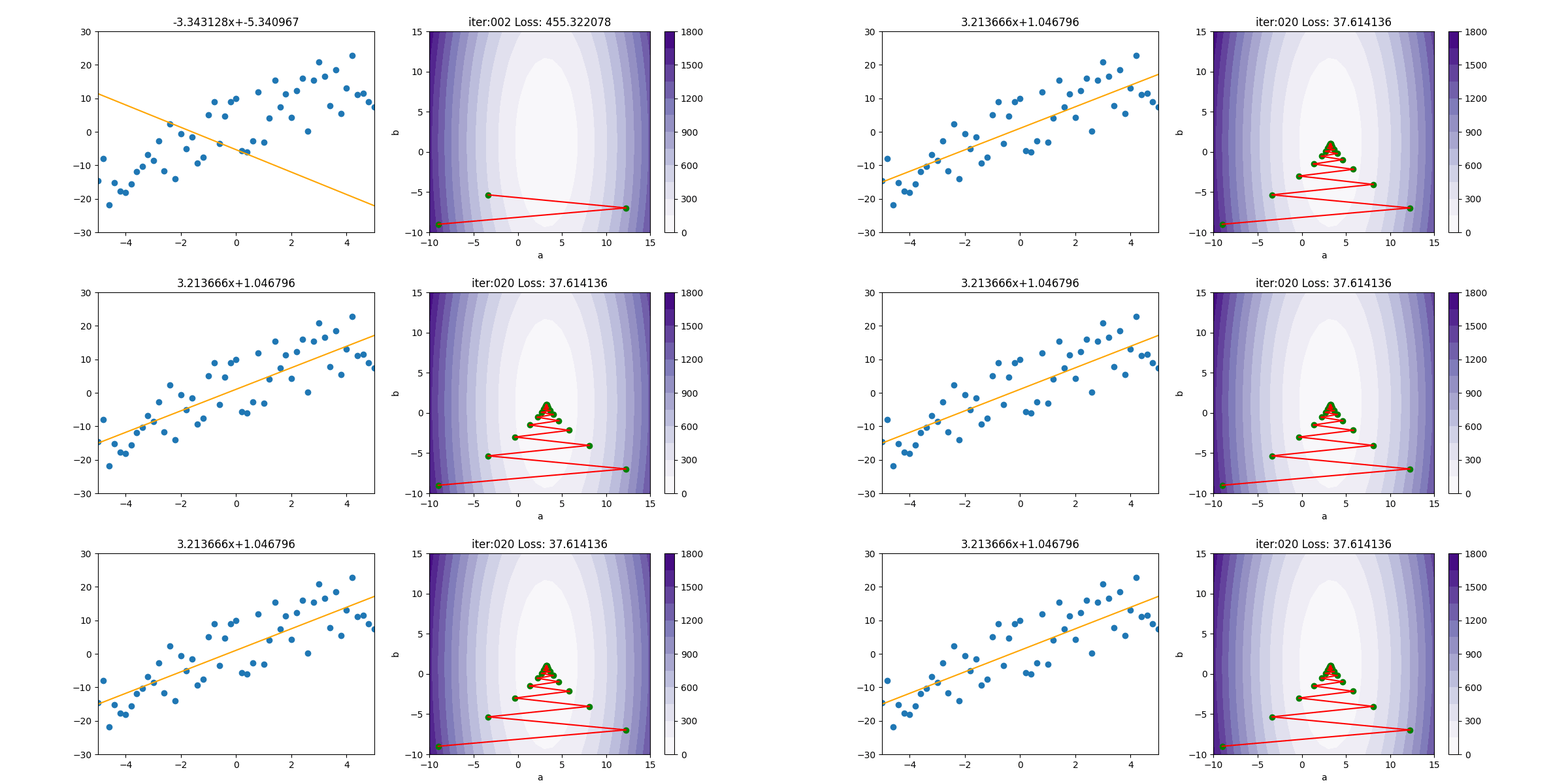
BGD 損失率圖解
BGD 是Bitch Gradient Descent (批次梯度下降) 的縮寫。
底下是產生迴歸線資料 Regression.py 的代碼
#pip install matplotlib
import numpy as np
np.random.seed(1)
def getData(n):
    x = np.arange(-5, 5.1, 10 / n)
    y = 3 * x + 2 + (np.random.rand(len(x)) - 0.5) * 20
    return x, y

#取得等高線
def getContour(x, y):
    a=np.arange(-10,16,1)
    b=np.arange(-10,16,1)
    mesh=np.meshgrid(a,b)
    loss=np.zeros([len(a),len(b)])
    for p_x, p_y in zip(x, y):
        loss+=((mesh[0]*p_x+mesh[1])-p_y)**2
    loss/=len(x)
    return mesh,loss
BDG的損失函數梯度下降後,
$(\frac{\sigma Loss(a,b)}{\sigma a}=\frac{2}{n}\sum_{i=1}^{n}(ax_{i}+b-\tilde{y_{i}})*x_{i})$
$(\frac{\sigma Loss(a,b)}{\sigma b}=\frac{2}{n}\sum_{i=1}^{n}(ax_{i}+b-\tilde{y_{i}}))$
底下是BDG 類別 BDG.py 的代碼
import numpy as np
class BGD():
    def __init__(self, a, b, x, y, lr):
        self.a = a
        self.b = b
        self.x = x
        self.y = y
        self.lr = lr
        self.a_old = a
        self.b_old = b
        self.loss = None;

    def gradient(self):
        #偏微分時,如果有10億筆資料,底下就要加總10億次,會很慢
        #np.mean 跟 np.sum 一樣慢,把所有資料加總起來,再求平均數。
        grad_a = 2 * np.mean((self.a * self.x + self.b - self.y) * (self.x))
        grad_b = 2 * np.mean((self.a * self.x + self.b - self.y))
        return grad_a, grad_b
    def update(self):
        # 計算梯度
        grad_a, grad_b = self.gradient()
        # 梯度更新
        self.a_old = self.a
        self.b_old = self.b
        self.a = self.a - self.lr * grad_a
        self.b = self.b - self.lr * grad_b
        loss = ((self.a * self.x + self.b) - self.y) ** 2
        self.loss = np.mean(loss)
底下是主程式的代碼
#BGD : Batch Gradient Descent : 批量梯度下降
import pylab as plt
from BGD import BGD
from Regression import *
np.random.seed(1)
epoch=50
x,y = getData(100)
mesh, contour=getContour(x,y)
fig,ax=plt.subplots(nrows=1, ncols=2, figsize=(12,4))
a2=ax[1].contourf(mesh[0], mesh[1], contour, 15, cmap=plt.cm.Purples)
ax[1].set_xlabel("a")
ax[1].set_ylabel("b")
plt.colorbar(a2, ax=ax[1])
lr = 0.1
init_a=-9#初始值
init_b=-9
ax[1].scatter(init_a, init_b, c='g')
gd=BGD(init_a, init_b, x, y, lr)
for i in range(epoch):
    gd.update()
    ax[0].clear()
    ax[0].set_xlim(-5, 5)
    ax[0].set_ylim(-30,30)
    ax[0].scatter(x, y)
    ax[0].plot([x[0], x[-1]], [gd.a*x[0]+gd.b, gd.a*x[-1]+gd.b], c="orange")
    ax[0].set_title(f'{gd.a:.6f}x+{gd.b:.6f}')

    ax[1].set_xlim(-10, 15)
    ax[1].set_ylim(-10, 15)
    ax[1].set_title(f'iter:{i+1:03d}, loss={gd.loss:.6f}')
    ax[1].plot([gd.a_old, gd.a],[gd.b_old,gd.b],c='r')

    ax[1].scatter(gd.a, gd.b, c='g')

    plt.pause(0.01)
plt.show()

SGD 隨機梯度下降
SGD 為 Stochastic [stəˈkæstɪk] Gradient Descent 的縮寫。
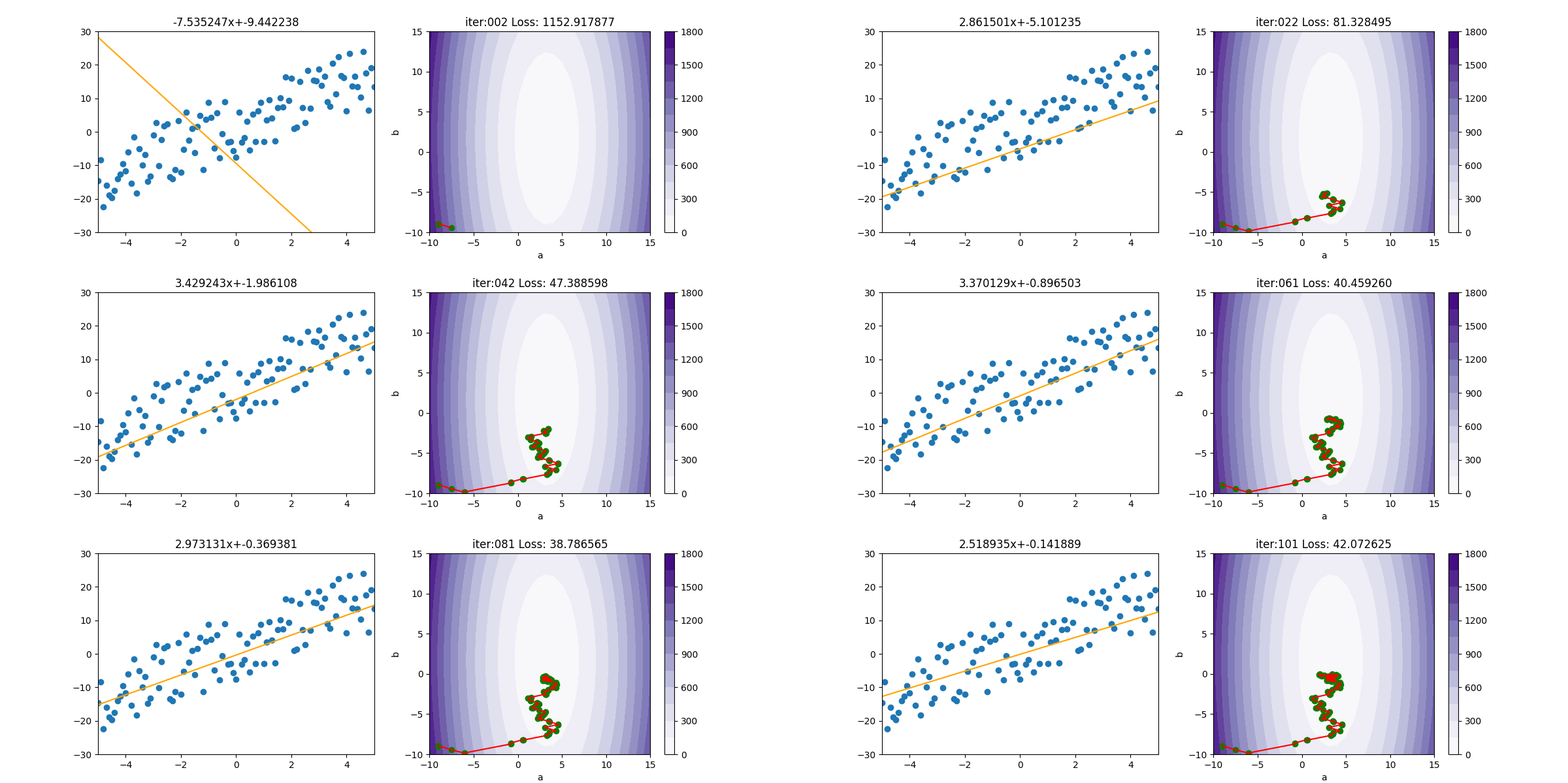
BDG 損失函數梯度下降後,公式為$(\frac{\sigma Loss(a,b)}{\sigma a}=\frac{2}{n}\sum_{i=1}^{n}(ax_{i}+b-\tilde{y_{i}})*x_{i})$,必需將所有的 $(x_{i})$ 及 $(y_{i})$全都計算一遍。如果 i 只有幾百或幾千個,那電腦還可應付,但如果有上百萬,上億個點呢,這下就吃不消了。
SGD 就是把 $(\sum)$ 拿掉,然後使用亂數隨便取一個 x 及 y 來計算,這樣原本要加總計算上億個值,變成只要計算一次,就快很多了。當然啦,天下沒有白吃的午餐,如下圖所示,會呈現極不穩定的狀態。
SGD類別如下
from BGD import BGD
import numpy as np
class SGD(BGD):
    def __init__(self, a, b, x, y, lr):
        super().__init__(a, b, x, y, lr)
    def gradient(self):
        # 隨機取一筆資料進行計算
        idx = np.random.randint(len(self.x))
        grad_a = 2 * (self.a * self.x[idx] + self.b - self.y[idx]) * (self.x[idx])
        grad_b = 2 * (self.a * self.x[idx] + self.b - self.y[idx])
        return grad_a, grad_b
主程式如下
from Regression import *
import pylab as plt
from SGD import SGD
epoch=40
x,y=getData(100)
mesh, contour=getContour(x,y)
fig, ax=plt.subplots(nrows=1, ncols=2, figsize=(12,4))

a2=ax[1].contourf(mesh[0], mesh[1], contour,15, cmap=plt.cm.Purples)
plt.colorbar(a2,ax=ax[1])

lr = 0.01
init_a = -9; init_b = -9
ax[1].scatter(init_a, init_b, c='g')
gd = SGD(init_a, init_b, x, y, lr)
for i in range(epoch):
    gd.update()
    ax[0].clear()
    ax[0].set_xlim(-5,5)
    ax[0].set_ylim(-30, 30)
    ax[0].scatter(x, y)
    ax[0].plot([x[0], x[-1]],[gd.a*x[0]+gd.b, gd.a*x[-1]+gd.b], c="orange")
    ax[0].set_title(f'{gd.a:.6f}x+{gd.b:.6f}')

    print('iter=' + str(i) + ', loss=' + '{:.2f}'.format(gd.loss))
    ax[1].set_xlim(-10,15)
    ax[1].set_ylim(-10, 15)
    ax[1].set_title(f'iter:{i:03d} Loss: {gd.loss:6f}')
    ax[1].plot([gd.a_old, gd.a], [gd.b_old, gd.b], c='r')
    ax[1].scatter(gd.a, gd.b, c='g')
    ax[1].set_xlabel("a")
    ax[1].set_ylabel("b")
    plt.pause(0.01)
plt.show()

MBGD 小批量梯度下降
MBGD為 mini-batch gradient descent的縮寫。
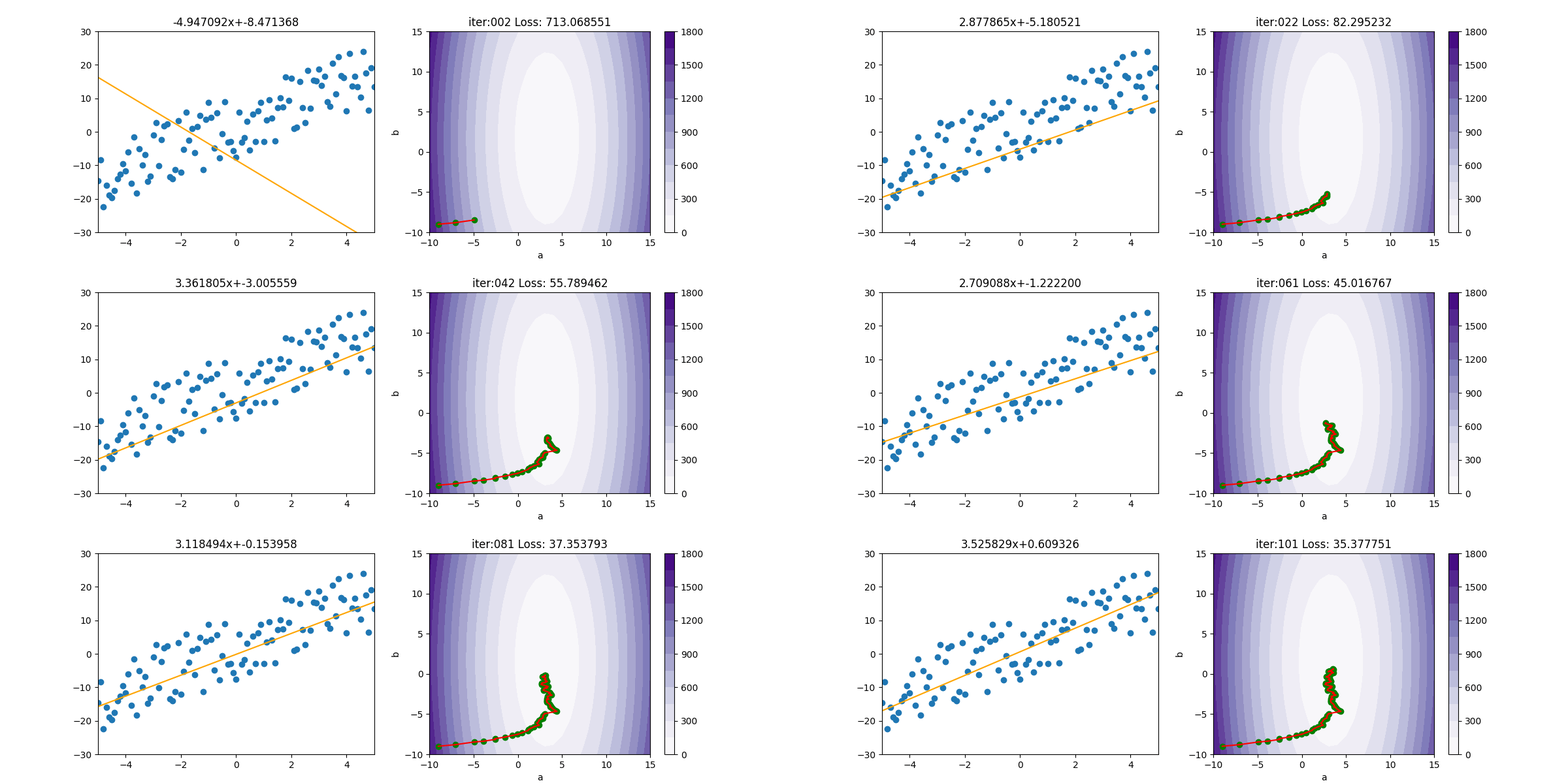
因為SGD隨便選一個點來計算實在是不準確,所以就隨便選個100個點,或1000個點來計算。由底下的圖式可看出,確實平穩了許多,速度也快很多。MBGD 計算損失時,會產生 np.nan,所以如果遇到 np.nan 時,就中斷。
SGD 實在是上不了台面的,所以一般人家講的 SGD,其實是指 MBGD。
MBGD類別如下
from BGD import BGD
import numpy as np
class MBGD(BGD):
    def __init__(self, a, b, x, y, lr, batch_size):
        super().__init__(a, b, x, y, lr)
        self.batch_size=batch_size
        self.suffle=np.random.permutation(len(x))
        self.refresh()
        self.update_batch()
    def refresh(self):
        self.suffle=np.random.permutation(len(self.x))
        self.start=0
    def update_batch(self):
        idx = self.suffle[self.start:self.start + self.batch_size]
        self.start+=self.batch_size
        self.x_batch = self.x[idx]
        self.y_batch = self.y[idx]
    def gradient(self):
        grad_a = 2 * np.mean((self.a * self.x_batch + self.b - self.y_batch) * (self.x_batch))
        grad_b = 2 * np.mean((self.a * self.x_batch + self.b - self.y_batch))

        #底下為提取批量到結尾,需重新打亂再重頭提取,避免 loss 為 nan
        if self.start>len(self.x):
            self.refresh()
        self.update_batch()
        return grad_a, grad_b
主程式如下
from MBGD import MBGD
from Regression import *
import pylab as plt
epoch=200
x,y=getData(100)
mesh, contour=getContour(x,y)
fig, ax=plt.subplots(nrows=1, ncols=2, figsize=(12,4))

a2=ax[1].contourf(mesh[0], mesh[1], contour, 15, cmap=plt.cm.Purples)
plt.colorbar(a2,ax=ax[1])

lr=1e-2
init_a = -9; init_b = -9
ax[1].scatter(init_a, init_b, c='g')
batch_size=25
gd = MBGD(init_a, init_b, x, y, lr, batch_size)
for i in range(epoch):
    gd.update()
    ax[0].clear()
    ax[0].set_xlim(-5,5)
    ax[0].set_ylim(-30, 30)
    ax[0].scatter(x, y)
    ax[0].plot([x[0], x[-1]],[gd.a*x[0]+gd.b, gd.a*x[-1]+gd.b], c="orange")
    ax[0].set_title(f'{gd.a:.6f}x+{gd.b:.6f}')

    print('iter=' + str(i) + ', loss=' + '{:.2f}'.format(gd.loss))
    ax[1].set_xlim(-10,15)
    ax[1].set_ylim(-10, 15)
    ax[1].set_title(f'iter:{i+1:03d} Loss: {gd.loss:6f}')
    ax[1].plot([gd.a_old, gd.a], [gd.b_old, gd.b], c='r')
    ax[1].scatter(gd.a, gd.b, c='g')
    ax[1].set_xlabel("a")
    ax[1].set_ylabel("b")
    plt.pause(0.01)
plt.show()

SGD + 動量
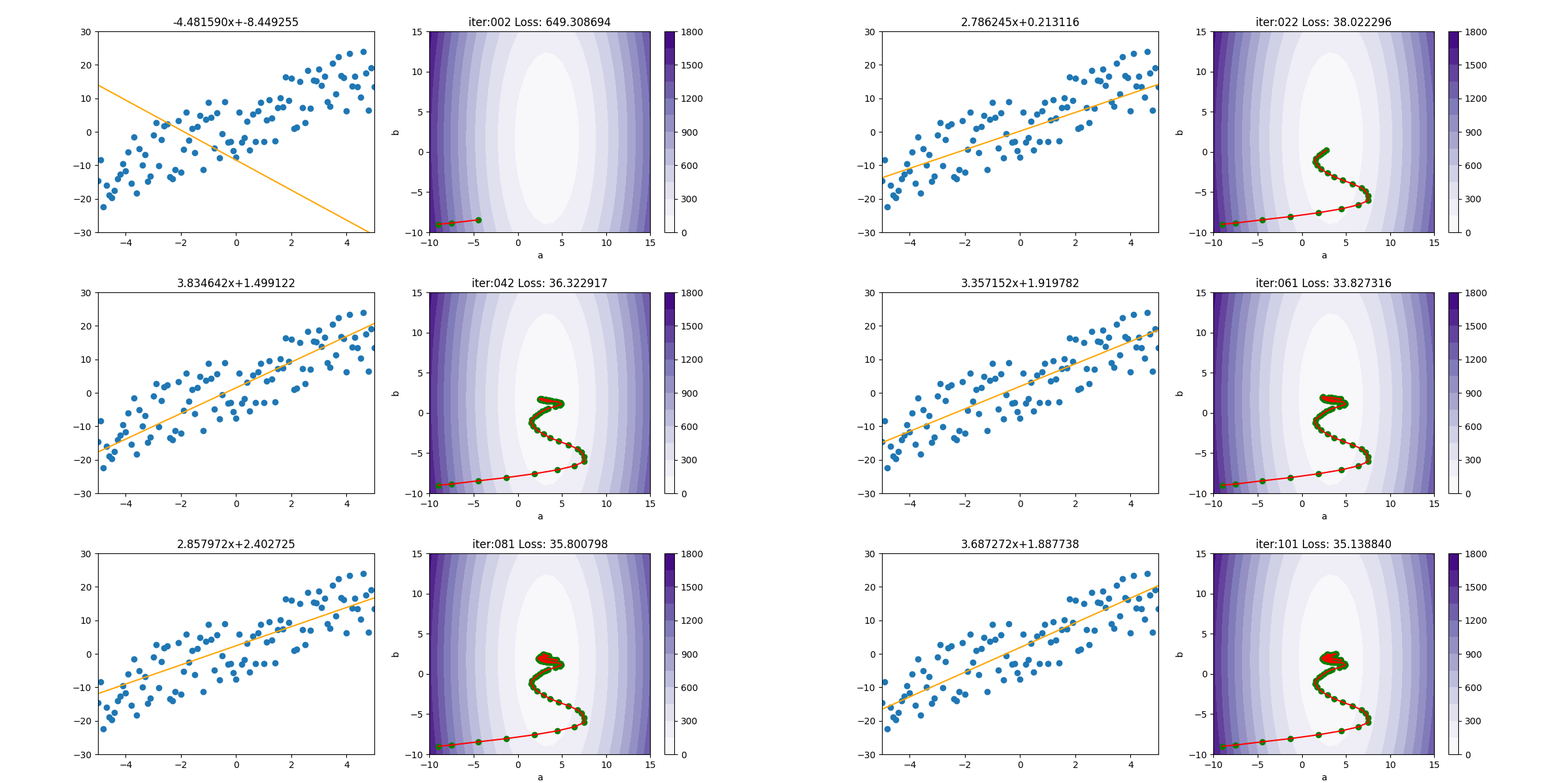
上述的 MBGD 很容易卡在鞍點,所以可以再加入動量。本例應該是 MBGDM,但大家都稱 MBGD 為 SGD,所以本例命名為 SGDM
SGDM類別如下
from MBGD import MBGD
import numpy as np
class SGDM(MBGD):
    def __init__(self, a, b, x, y, lr, batch_size, gamma):
        super().__init__(a, b, x, y, lr, batch_size)
        self.gamma=gamma
        self.ma=0
        self.mb=0
    def update(self):
        grad_a, grad_b = self.gradient()
        self.a_old = self.a
        self.b_old = self.b
        self.ma = self.gamma * self.ma + self.lr * grad_a
        self.mb = self.gamma * self.mb + self.lr * grad_b
        self.a -=self.ma
        self.b -=self.mb
        loss = ((self.a * self.x + self.b) - self.y) ** 2
        self.loss = np.mean(loss)
主程式如下
from SGDM import SGDM
from Regression import *
import pylab as plt
epoch=40
x,y=getData(100)
mesh, contour=getContour(x,y)
fig, ax=plt.subplots(nrows=1, ncols=2, figsize=(12,4))

a2=ax[1].contourf(mesh[0], mesh[1], contour, 15, cmap=plt.cm.Purples)
plt.colorbar(a2,ax=ax[1])

lr = 0.01
init_a = -9; init_b = -9
ax[1].scatter(init_a, init_b, c='g')
batch_size=5
gamma=0.8
gd = SGDM(init_a, init_b, x, y, lr, batch_size, gamma)
for i in range(epoch):
    gd.update()
    ax[0].clear()
    ax[0].set_xlim(-5,5)
    ax[0].set_ylim(-30, 30)
    ax[0].scatter(x, y)
    ax[0].plot([x[0], x[-1]], [gd.a * x[0] + gd.b, gd.a * x[-1] + gd.b], c="orange")
    ax[0].set_title(f'{gd.a:.6f}x+{gd.b:.6f}')

    print('iter=' + str(i) + ', loss=' + '{:.2f}'.format(gd.loss))
    ax[1].set_xlim(-10,15)
    ax[1].set_ylim(-10, 15)
    ax[1].set_title(f'iter:{i+1:03d} Loss: {gd.loss:6f}')
    ax[1].plot([gd.a_old, gd.a], [gd.b_old, gd.b],  c= 'r')
    ax[1].scatter(gd.a, gd.b, c='g')
    ax[1].set_xlabel("a")
    ax[1].set_ylabel("b")
    plt.pause(0.01)
plt.show()

