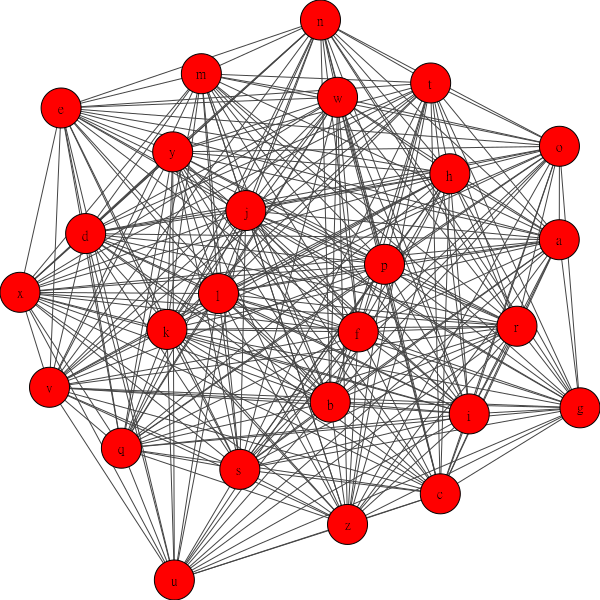
igraph套件可以處理複雜網路聚類,也稱為社群檢測. 舉例來說, 你的fb有100個朋友, 而你的朋友也有他自已的朋友, 這樣就形成了一個複雜的網狀結構. igraph可以把這個複雜的網狀結構列印出來. 就好比下方這個圖形
安裝
早期 igraph 使用 cairo 顯示圖形,所以要連同 cairo 一併安裝,但用 pip 卻又裝不起來。
後來 igraph 改用 matplotlib 顯示圖形, 所以直接在 Terminal 執行如下指令即可安裝
pip install igrpah matplotlib
測試
輸入如下代碼, 若能正確執行, 表示安裝成功
import pylab as plt
import igraph as ig
ax=plt.subplot()
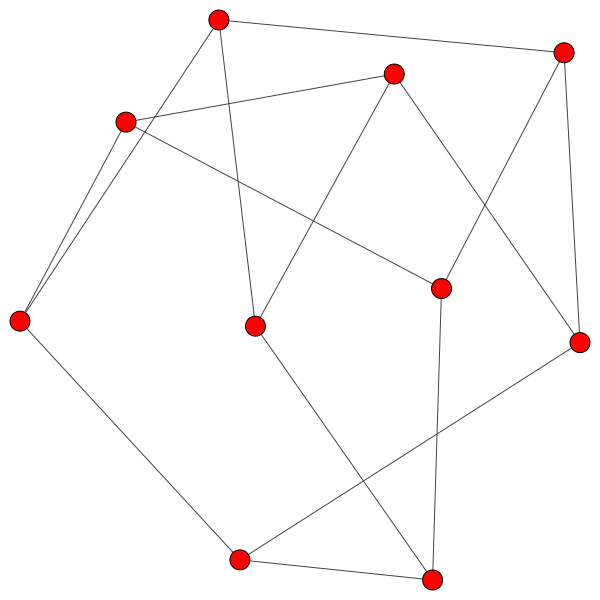
g = ig.Graph.Famous("petersen")
ig.summary(g)
ig.plot(g, target=ax)
plt.show()
產生繪制物件
ig.Graph()可以產生繪圖物件,所有圖型皆置於此物件之上。
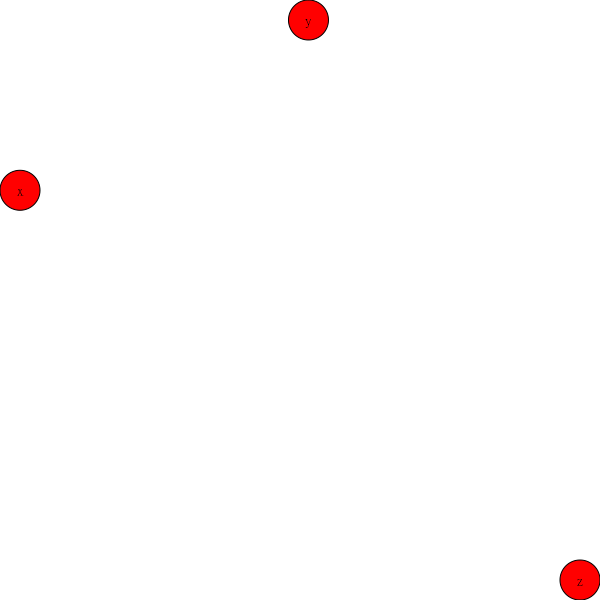
增加節點
首先使用 g.add_vertex()新增單一頂點, 或使用 g.add_vertices([]) 增加多個頂點。
import pylab as plt
import igraph as ig
plt.figure(figsize=(6,6))
ax=plt.subplot()
g=ig.Graph()
g.add_vertices(['x','y','z'])

visual_style = {}
visual_style["vertex_size"] = 0.1
visual_style["vertex_label"] = g.vs['name']
ig.plot(g,target=ax, **visual_style)
plt.show()
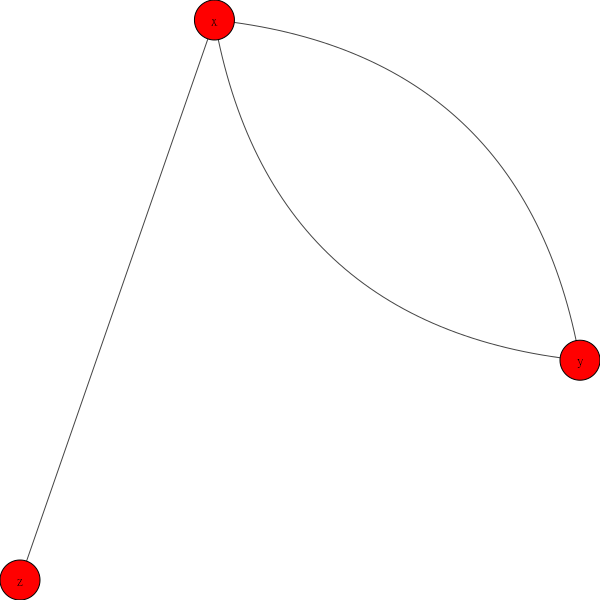
繪制關連線
使用 g.add_edge(x, y) 增加 x 點到 y點的連接線。如下同時新增 x -> y 及 y->x,所以 x 及 y 之間會有二條連接線。每點可以使用 vertices的索引(0,1,2),或是別名(‘x’, ‘y’,’z’)
import pylab as plt
import igraph as ig
ax=plt.subplot()
g=ig.Graph()
g.add_vertices(['x','y','z'])
g.add_edge(0,1)
g.add_edge('y',0)
g.add_edge('x','z')
visual_style = {}
visual_style["vertex_size"] = 0.4
visual_style["vertex_label"] = g.vs['name']
ig.plot(g,target=ax,layout = layout, **visual_style)
plt.show()
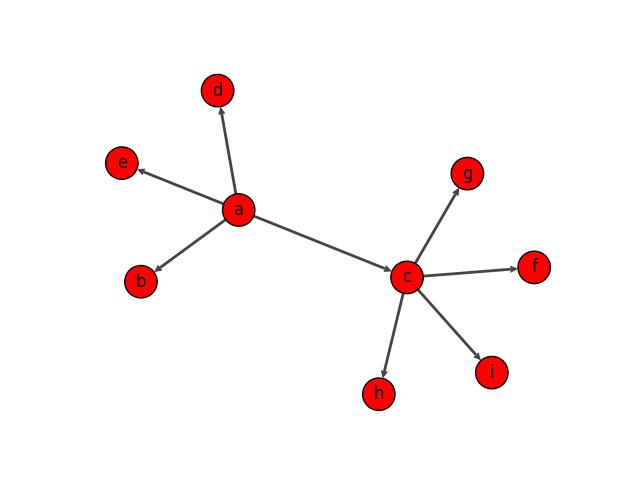
簡易範例
首先使用 g.add_vertices()新增多個頂點, 再使用g.add_edge()增加相鄰的節點
import igraph as ig
import pylab as plt
g = ig.Graph(directed=True)#可產生箭頭
v=['{0:c}'.format(i) for i in range(97,106)]
g.add_vertices(v)

g.add_edge('a','b')
g.add_edge('a','c')
g.add_edge('a','d')
g.add_edge('a','e')
g.add_edge('c','f')
g.add_edge('c','g')
g.add_edge('c','h')
g.add_edge('c','i')

visual_style = {}
visual_style["vertex_size"] = 0.4
visual_style["vertex_label"] = g.vs['name']
ax=plt.subplot()
ig.plot(g, target=ax, **visual_style)
plt.show()
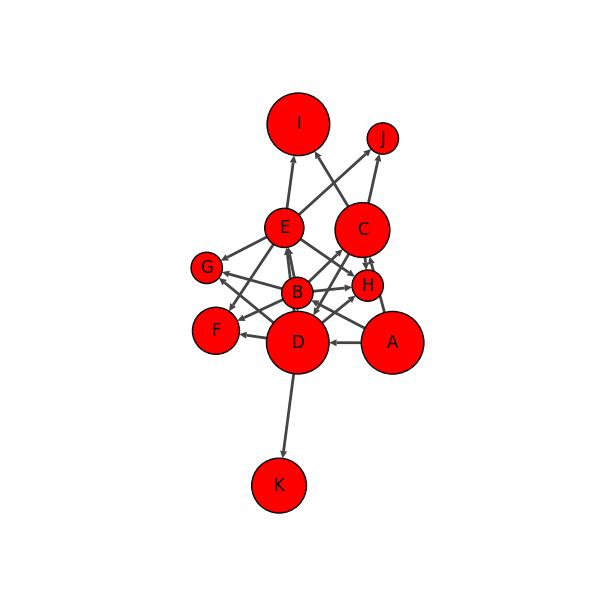
製作資料文字檔
節點的相鄰關係, 可以使用文字檔記錄後, 再讀取文字檔即可. 請將底下的數字copy 到 data.txt內. 每組數字之間, 只能使用空格隔開, 不可以使用 ‘,’
0 1
0 2
0 3
1 2
1 3
1 4
1 5
1 6
1 7
2 7
2 3
2 8
2 9
3 4
3 5
3 6
3 7
3 10
4 5
4 6
4 7
4 8
4 9
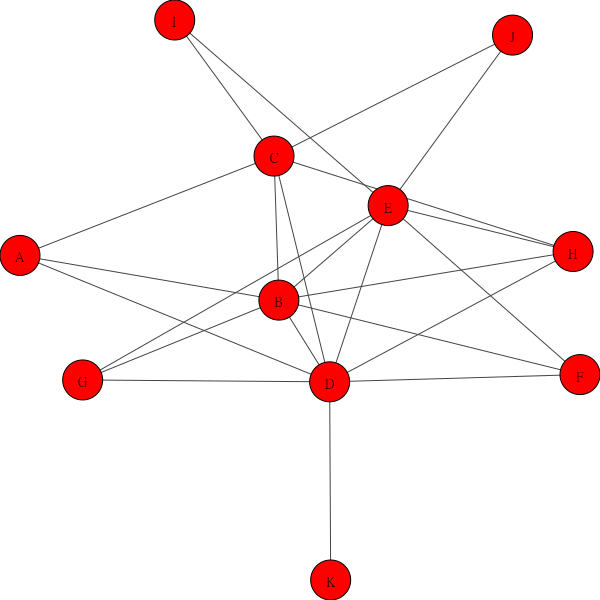
讀取資料文字檔
使用 ig.Graph.Read_Edgelist() 可讀取文字檔的資料,形成 vertex 及邊線
import igraph as ig
import pylab as plt
import numpy as np
g=ig.Graph.Read_Edgelist('data.txt', directed=True)
label=['A','B','C','D','E','F','G','H','I','J', 'K']
visual_style = {}

visual_style["vertex_size"] = np.random.randint(4,9,11)*0.1
visual_style["vertex_label"] = label
print(g.get_adjacency())
for v in g.vs:
    print(v.index)

plt.figure(figsize=(6,6))
ax=plt.subplot()
ig.plot(g, target=ax, **visual_style)
plt.show()
模擬FB網路朋友
import random
import pylab as plt
import igraph as ig
random.seed(1)
person={}
n=26
for i in range(n):
    friends=set([])
    for j in range(n):
        rnd=random.randint(0,n-1)
        if i!=rnd:
            friends.add(rnd)
    person[i]=friends
for key in person:
    print(key, person[key])
print("===========================================")
#取消相互連結
single={}
for i in range(n):
    single[i]=set([])
for key in person:
    for x in person[key]:
        single[min(x,key)].add(max(x,key))
for key in single:
    print(key,single[key])

g = ig.Graph()
g.add_vertices([f'{i+97:c}' for i in single.keys()])
for key in single:
    for x in single[key]:
        g.add_edge(key,x)
visual_style = {}
visual_style["edge_width"] = 1
visual_style["edge_color"] = "#ff0000"
visual_style["vertex_size"] = 0.3
visual_style["vertex_label"] = g.vs['name']
plt.figure(figsize=(6,6))
ax=plt.subplot()
ig.plot(g,target=ax, **visual_style)
plt.show()