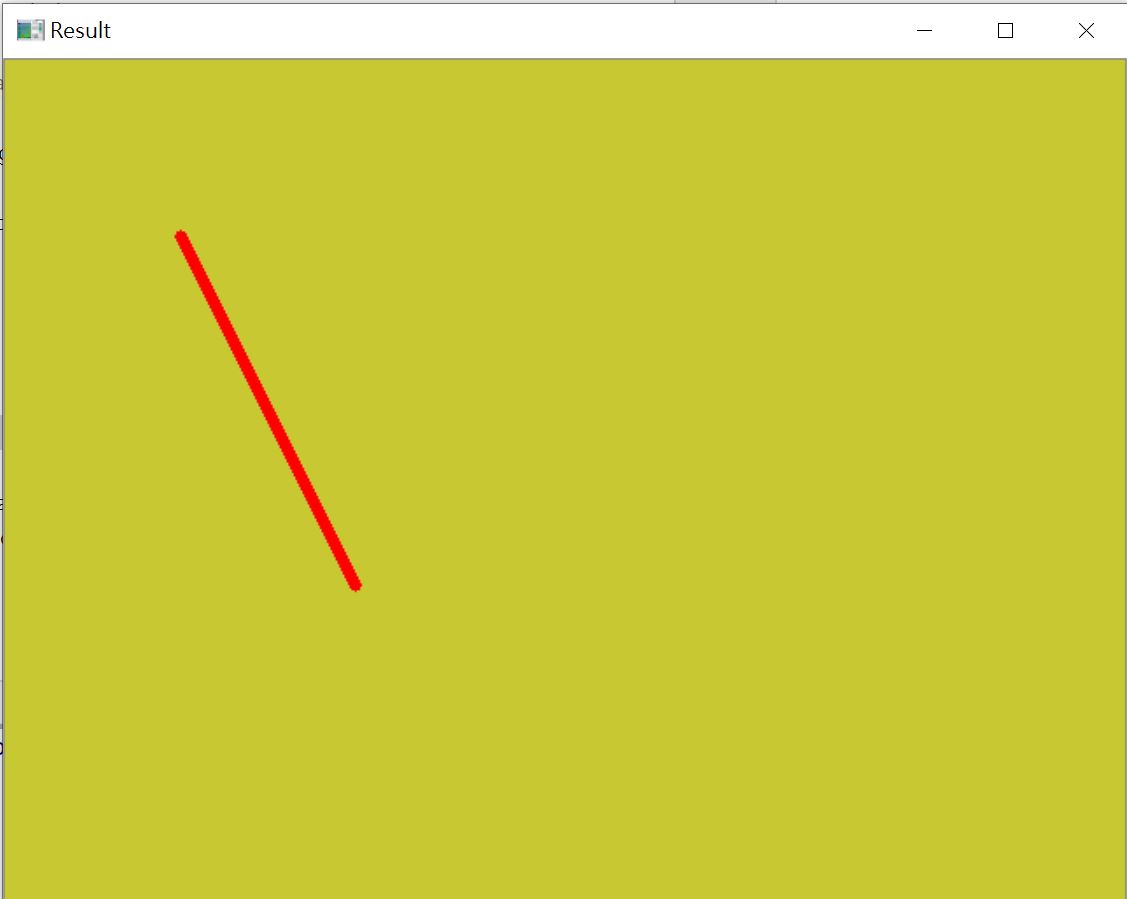
直線
cv2.line(image, (x1, y1), (x2, y2), color, 線條寬度)
import cv2
import numpy as np
#產生640*480圖像
image = np.zeros([480, 600, 3], np.uint8)
# 背景填入紅色
image[:] = (50, 200, 200)#BGR
red_color = (0, 0, 255) # BGR
cv2.line(image, (100, 100), (200, 300), red_color, 5)
cv2.imshow('Result', image)
cv2.waitKey(0)
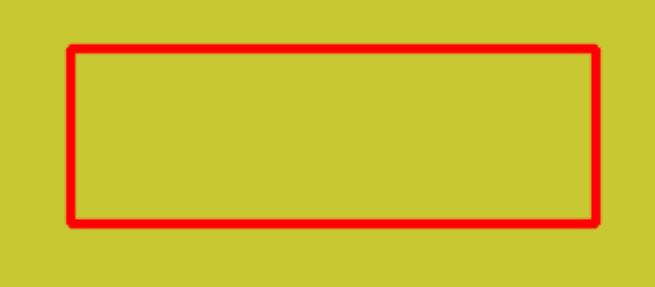
矩型
cv2.rectangle(image, (x1, y1), (x2, y2), color, 寬度, 樣式)
import cv2
import numpy as np
#產生640*480圖像
image = np.zeros((480, 640, 3), np.uint8)
# 背景填入紅色
image[:] = (50, 200, 200)#BGR
red_color = (0, 0, 255) # BGR
cv2.rectangle(image, (100, 100), (400, 200), red_color, 3, cv2.LINE_AA)
cv2.imshow('Result', image)
cv2.waitKey(0)
圓型
底下的寬度若為正值, 則只有外框。若為負值,則為填滿
cv2.circle(image, (x, y), 半徑, color, 寬度)
cv2.circle(image, (300, 200), 50, red_color, -1)
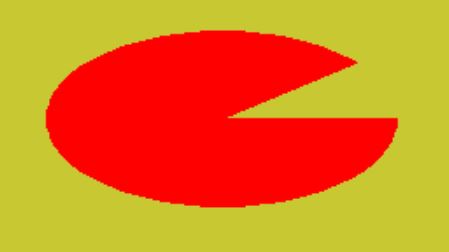
橢圓
cv2.ellipse(image, center, axes, angle, startAngle, endAngle, color, thickness)
import cv2
import numpy as np
#產生640*480圖像
image = np.zeros((480, 640, 3), np.uint8)
# 背景填入紅色
image[:] = (50, 200, 200)#BGR
red_color = (0, 0, 255) # BGR
center = (300, 300)
axes = (100, 50)
angle = 0
startAngle = 0
endAngle = 320
thickness = -1
cv2.ellipse(image, center, axes, angle, startAngle, endAngle, red_color, thickness)
cv2.imshow('Result', image)
cv2.waitKey(0)
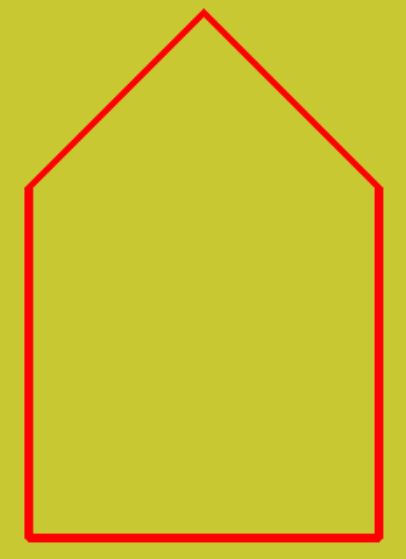
多邊型
points = np.array([[200, 200], [300, 100], [400, 200], [400, 400], [200, 400]], np.int32)
cv2.polylines(image, pts=[points], isClosed=True, color=red_color, thickness=3)
import cv2
import numpy as np
#產生640*480圖像
image = np.zeros((480, 640, 3), np.uint8)
# 背景填入紅色
image[:] = (50, 200, 200)#BGR
red_color = (0, 0, 255) # BGR
center = (300, 300)
axes = (100, 50)
angle = 0
startAngle = 0
endAngle = 320
thickness = -1
points = np.array([[200, 200], [300, 100], [400, 200], [400, 400], [200, 400]], np.int32)
cv2.polylines(image, pts=[points], isClosed=True, color=red_color, thickness=3)
cv2.imshow('Result', image)
cv2.waitKey(0)
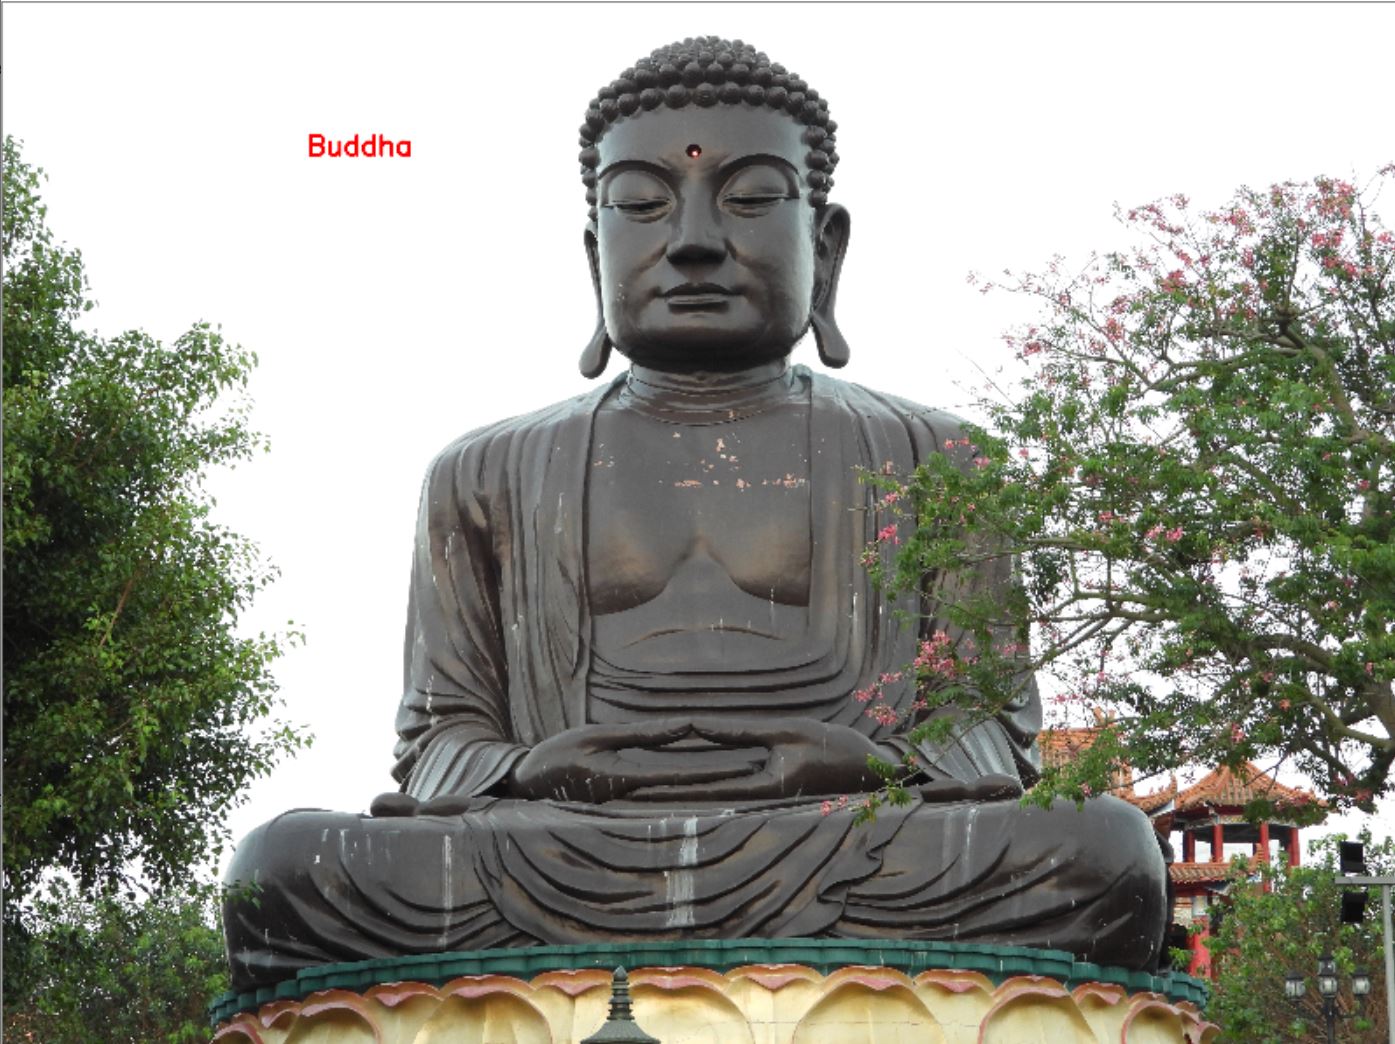
文字
cv2.putText(img, text, (1000, 500), cv2.FONT_HERSHEY_SIMPLEX,縮放比例, (0, 0, 255), 粗細, 樣式)
import cv2
img=cv2.imread('buddle.jpg')
text="Buddha"
cv2.putText(img, text, (1000, 500), cv2.FONT_HERSHEY_SIMPLEX,3, (0, 0, 255), 10, cv2.LINE_AA)
h, w=img.shape[:2]
nw=800
img=cv2.resize(img, (800, int(nw*h/w)), interpolation=cv2.INTER_LINEAR)
cv2.imshow('Title', img)
cv2.waitKey(0)
cv2.destroyAllWindows()
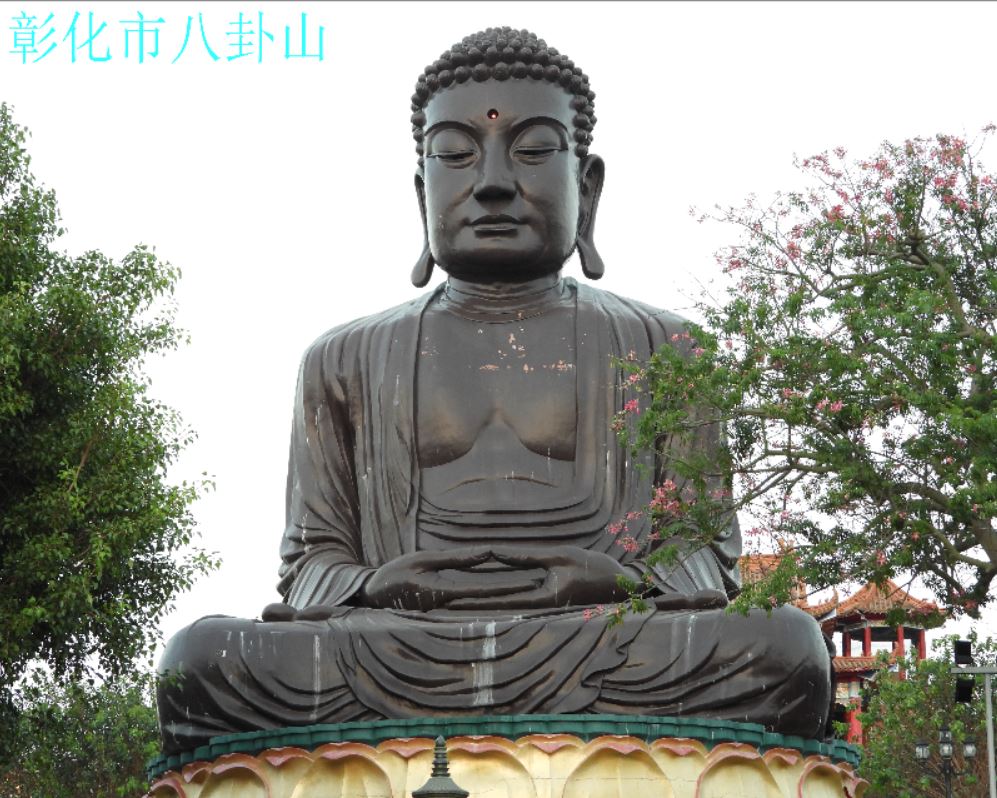
中文字型
OpenCv打死就是不支援中文,所以只能靠PIL套件繪制中文。首先將OpenCv的array轉成PIL格式,繪製中文後,再轉回OpenCv格式。
要注意的是,如果是在 Linux 之下,要先使用底下指令安裝字型
sudo apt-get install fonts-wqy-zenhei
import cv2
from PIL import Image, ImageFont, ImageDraw
import numpy as np
class MahalCv():
    @staticmethod
    def text(img, text, xy=(0,0), color=(0,0,0),size = 12):
        pil = Image.fromarray(img)
        s=platform.system()
        if s == "Linux":
            font =
              ImageFont.truetype('/usr/share/fonts/truetype/wqy/wqy-zenhei.ttc', size)
        elif s=="Darwin":
            font = ImageFont.truetype('....', size)
        else:
            font = ImageFont.truetype('simsun.ttc', size)
        ImageDraw.Draw(pil).text(xy, text, font=font, fill=color)
        return np.asarray(pil)
img=cv2.imread('buddle.jpg')
color=(50, 255, 255)
str='彰化市八卦山'
img=MahalCv.text(img,str,(30,30),250, color)
img=cv2.resize(img, (800,640), interpolation=cv2.INTER_LINEAR)
cv2.imshow('bgr', img)
cv2.waitKey(0)
cv2.destroyAllWindows()
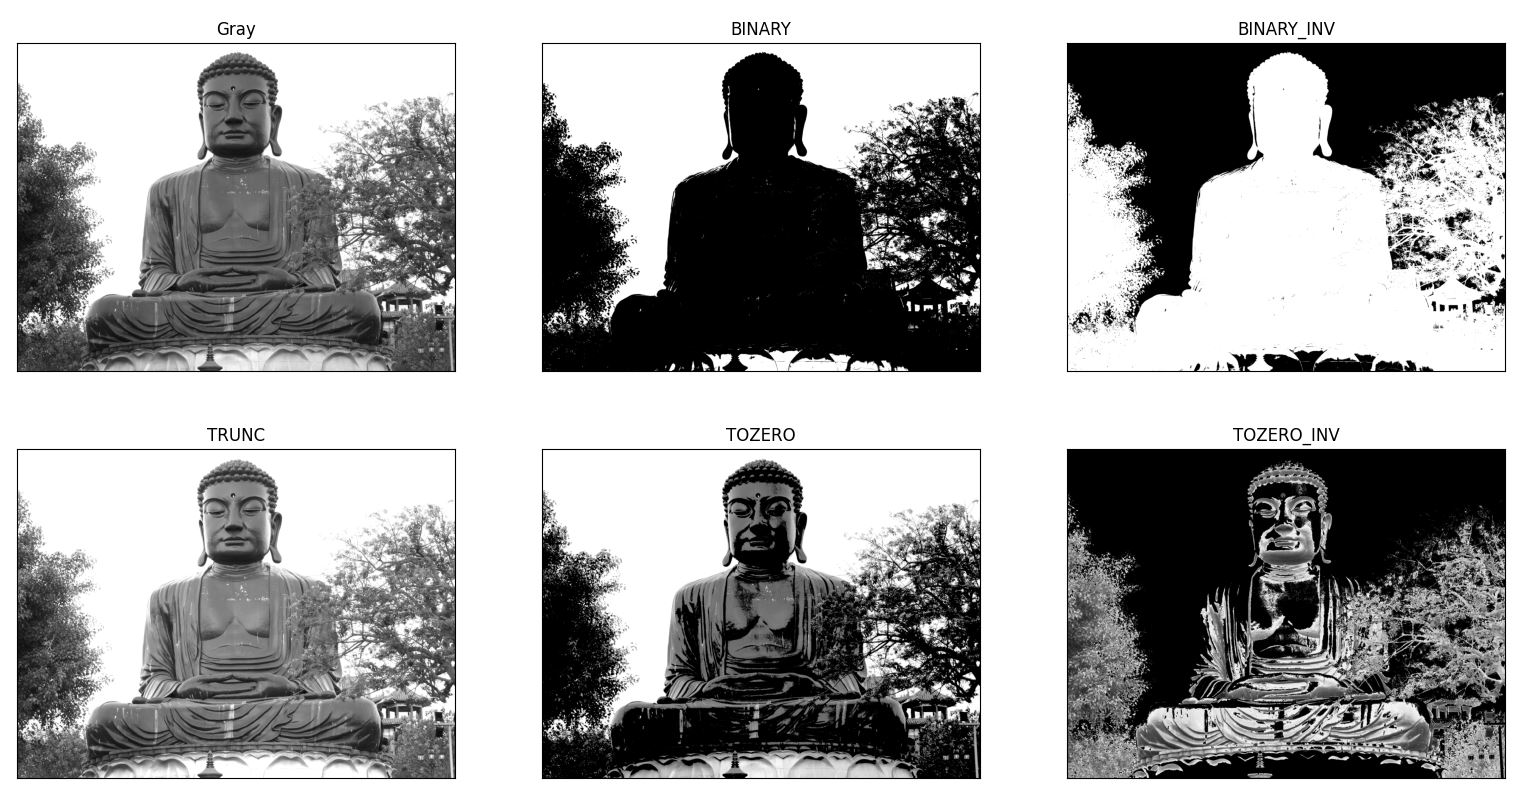
二值化
二值化是將像素值大於門檻值(threshold),就指定一個新的數值,否則就指定另一個新數值。二值化在圖片的範圍選取或是標示物件上是一個重要的遮罩片。OpenCv使用 cv2.threshold()即可達成二值化。
cv2.threshold(灰階img, threshold, value, style)
請注意,只有灰階256色的圖片才可以二值化。底下代碼示範先將圖片讀入後轉成灰階,再二值化
二值化有5 種方式
binary : 低於門檻值的變為0,等於或大於門檻值的變成第三個參數
binary_inv : 大於門檻值設為0, 其它變成第三個參數
trunc : 大於門檻值改為第三個參數, 小於門檻值顏色不變
tozero : 小於門檻值改為 0, 大於門檻值顏色不變
tozero_inv : 大於門檻值改為 0, 小於門檻值顏色不變
import cv2
import pylab as plt
img=cv2.imread('buddle.jpg')
img_gray=cv2.cvtColor(img, cv2.COLOR_BGR2GRAY)
ret, th1 = cv2.threshold(img_gray, 200, 255, cv2.THRESH_BINARY)
ret, th2 = cv2.threshold(img_gray, 200, 255, cv2.THRESH_BINARY_INV)
ret, th3 = cv2.threshold(img_gray, 200, 255, cv2.THRESH_TRUNC)
ret, th4 = cv2.threshold(img_gray, 100, 255, cv2.THRESH_TOZERO)
ret, th5 = cv2.threshold(img_gray, 100, 255, cv2.THRESH_TOZERO_INV)
titles = ['Gray', 'BINARY', 'BINARY_INV', 'TRUNC', 'TOZERO', 'TOZERO_INV']
images = [img_gray, th1, th2, th3, th4, th5]
for i in range(6):
    plt.subplot(2, 3, i+1), plt.imshow(images[i], cmap='gray')
    plt.title(titles[i])
    plt.xticks([]), plt.yticks([])
plt.show()
透明矩型-1
不論是要有透明的矩型,或者是中文字型,使用 openCV都無法達成。此時只能使用Image.Draw。底下程式中,image_box為openCV格式,所以先使用Image.formarray(image_box)轉成PIL的 Image格式,然後再轉成RGBA格式,此圖片以A來稱呼。
緊接著由A圖 copy 一張一模一樣的B圖,將矩型繪制於B圖上。
最後使用Image.blend渲染AB二張圖,並設定透明值, 即可產生所要的透明矩型。
#opencv無法製作透明文字
#1. 先產生 pil (a圖),並轉成RGBA
#2. 由 a 圖複製一張一模一樣的 b 圖(info)
#3. 在 b 圖畫矩型
#4. 將 a, b 圖 blend(混圖),二張圖的 alpha 各為 0.5,加起來為 1
#5. 將文字寫於 blend 後的圖
import cv2
from PIL import Image, ImageDraw, ImageFont
from sdk.MahalCv import MahalCv as cv
import pylab as plt
img=cv.read("1.jpg")
img=cv.resize(img, scale=0.2)
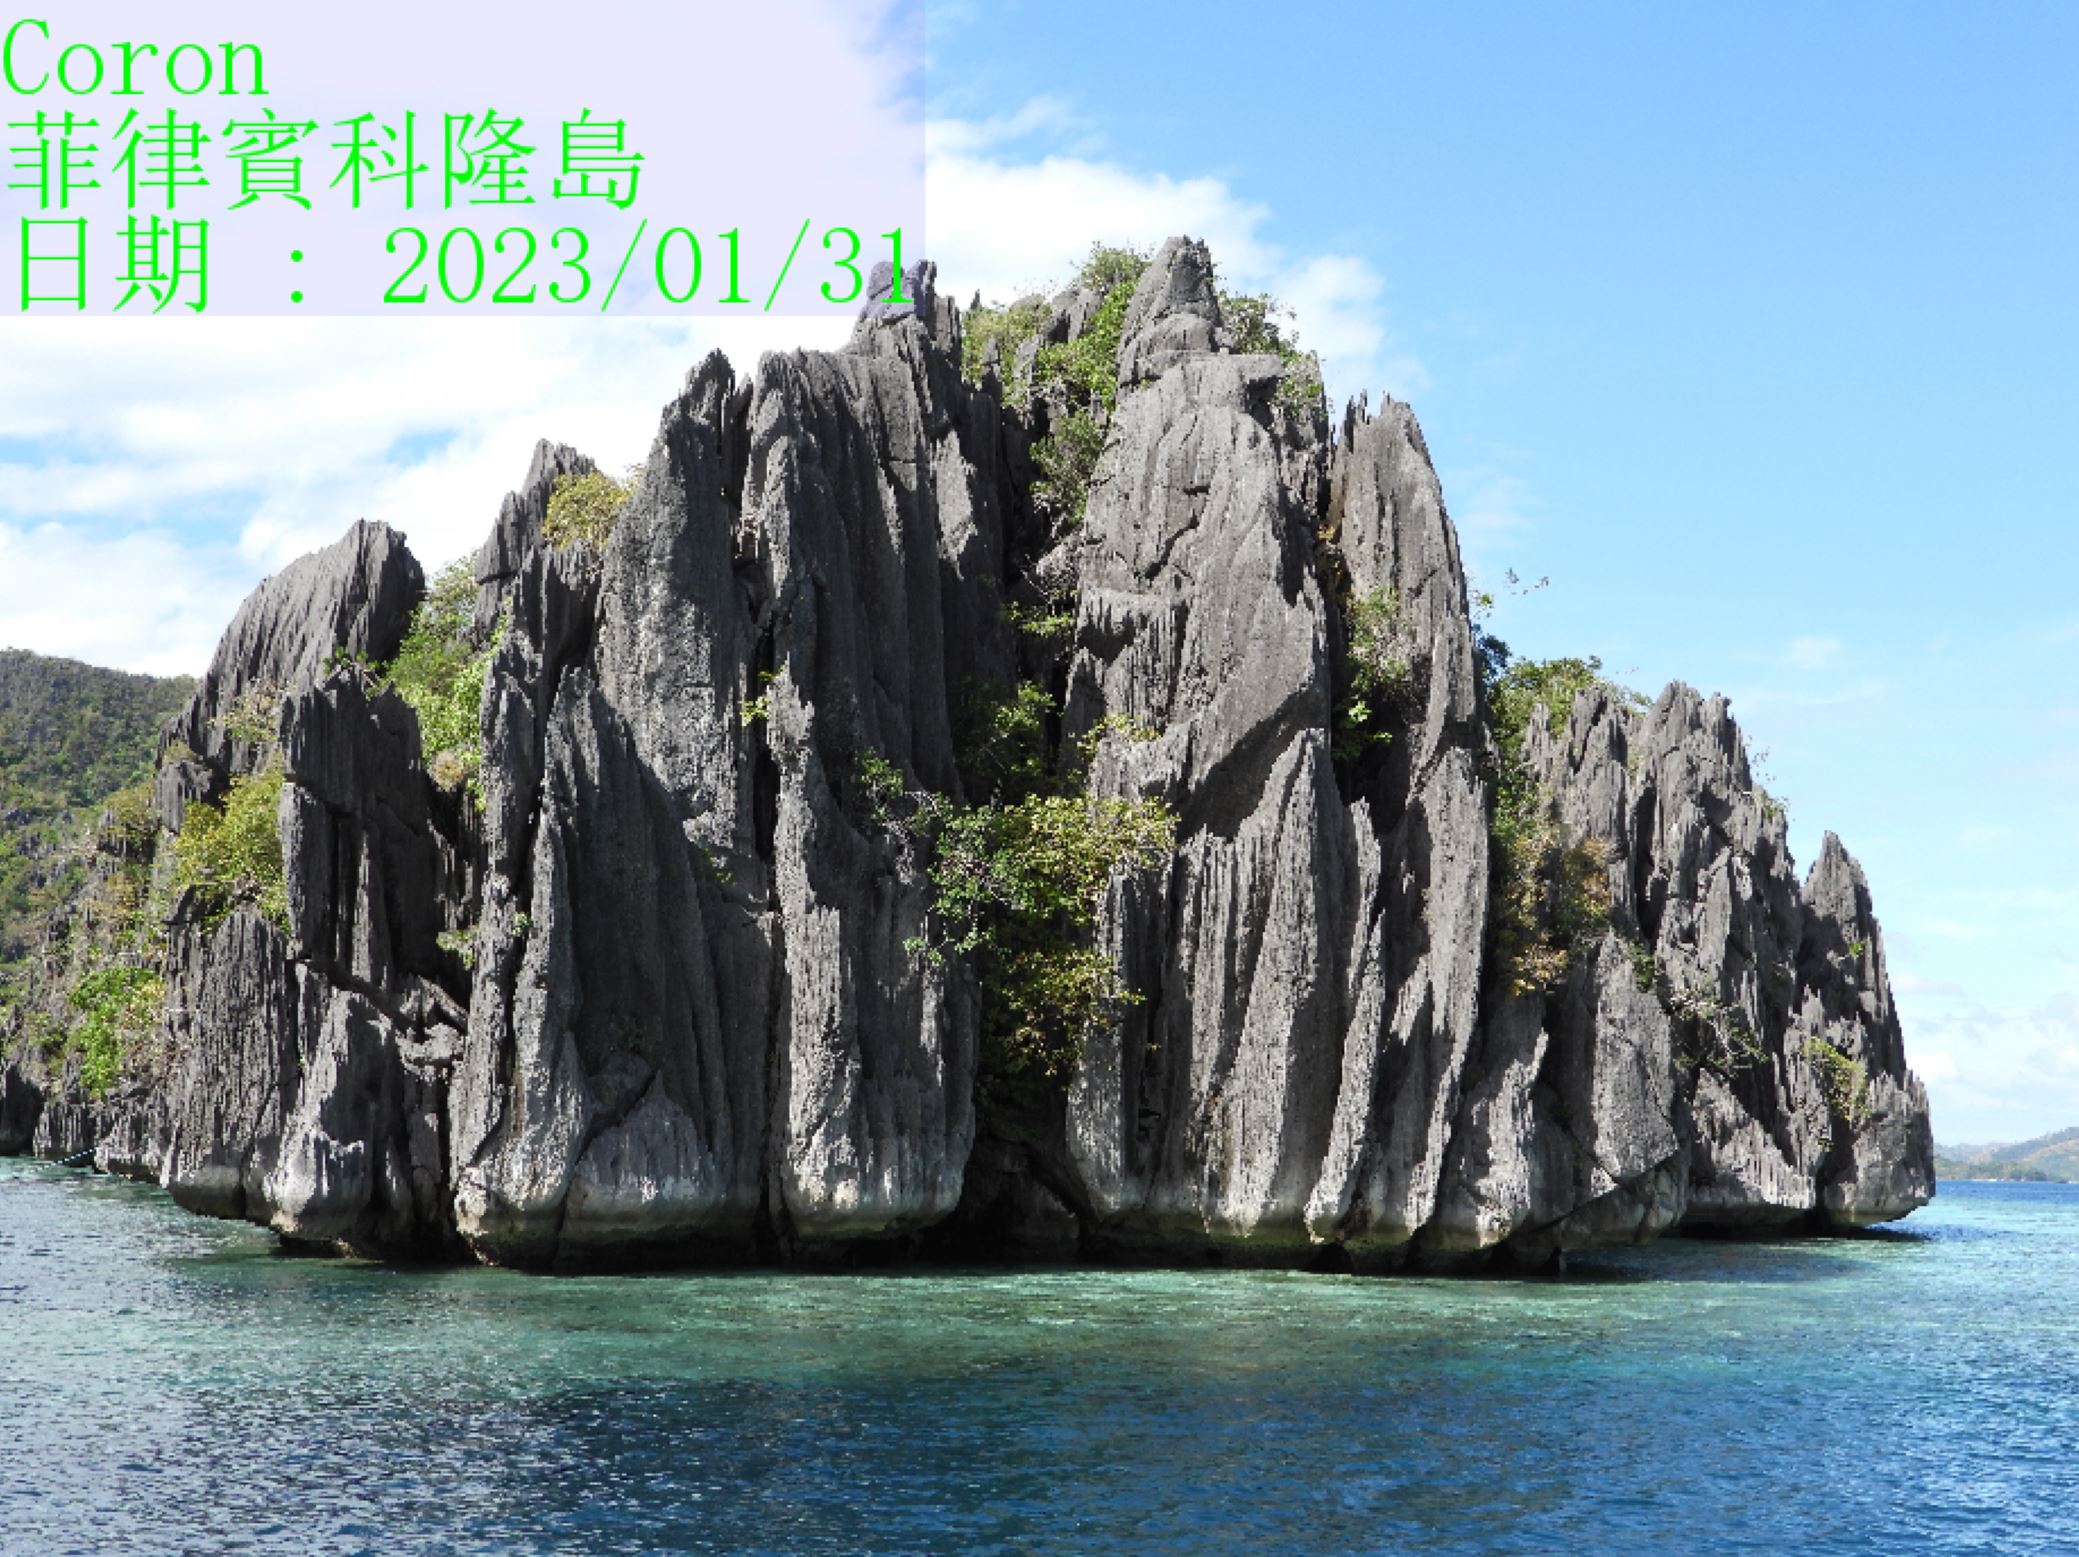
txt="Coron\n菲律賓科隆島\n日期 : 2023/01/31"
img=img[:,:,::-1].copy()
pil=Image.fromarray(img)
pil=pil.convert("RGBA") #稱為 a 圖
font=ImageFont.truetype('simsun.ttc', 48)
#偵測寫入文字後,文字所佔的寬及高,並不是實際寫入文字
draw=ImageDraw.Draw(pil)
x1=0
y1=0
#偵測寫入文字後,文字所佔的寬及高,並不是實際寫入文字
t_x1, t_y1, t_x2, t_y2=draw.textbbox(xy=(x1, y1),text=txt, font=font)
h, w, _=img.shape#圖片的寬高
info=pil.copy()#稱為 b 圖
x1=0
y1=h-(t_y2 - y1)
x2=t_x2
y2=h
ImageDraw.Draw(info).rectangle(
(x1, y1, x2, y2),
fill=(150,150,255)
)
#ImageDraw.Draw(info).text((x1+10, y1+10), txt, font=font, fill=(255,255,255))
pil=Image.blend(pil, info, 0.5)
#寫入文字
ImageDraw.Draw(pil).text((x1, y1), txt, font=font, fill=(0,255,0))
plt.imshow(pil)
plt.show()
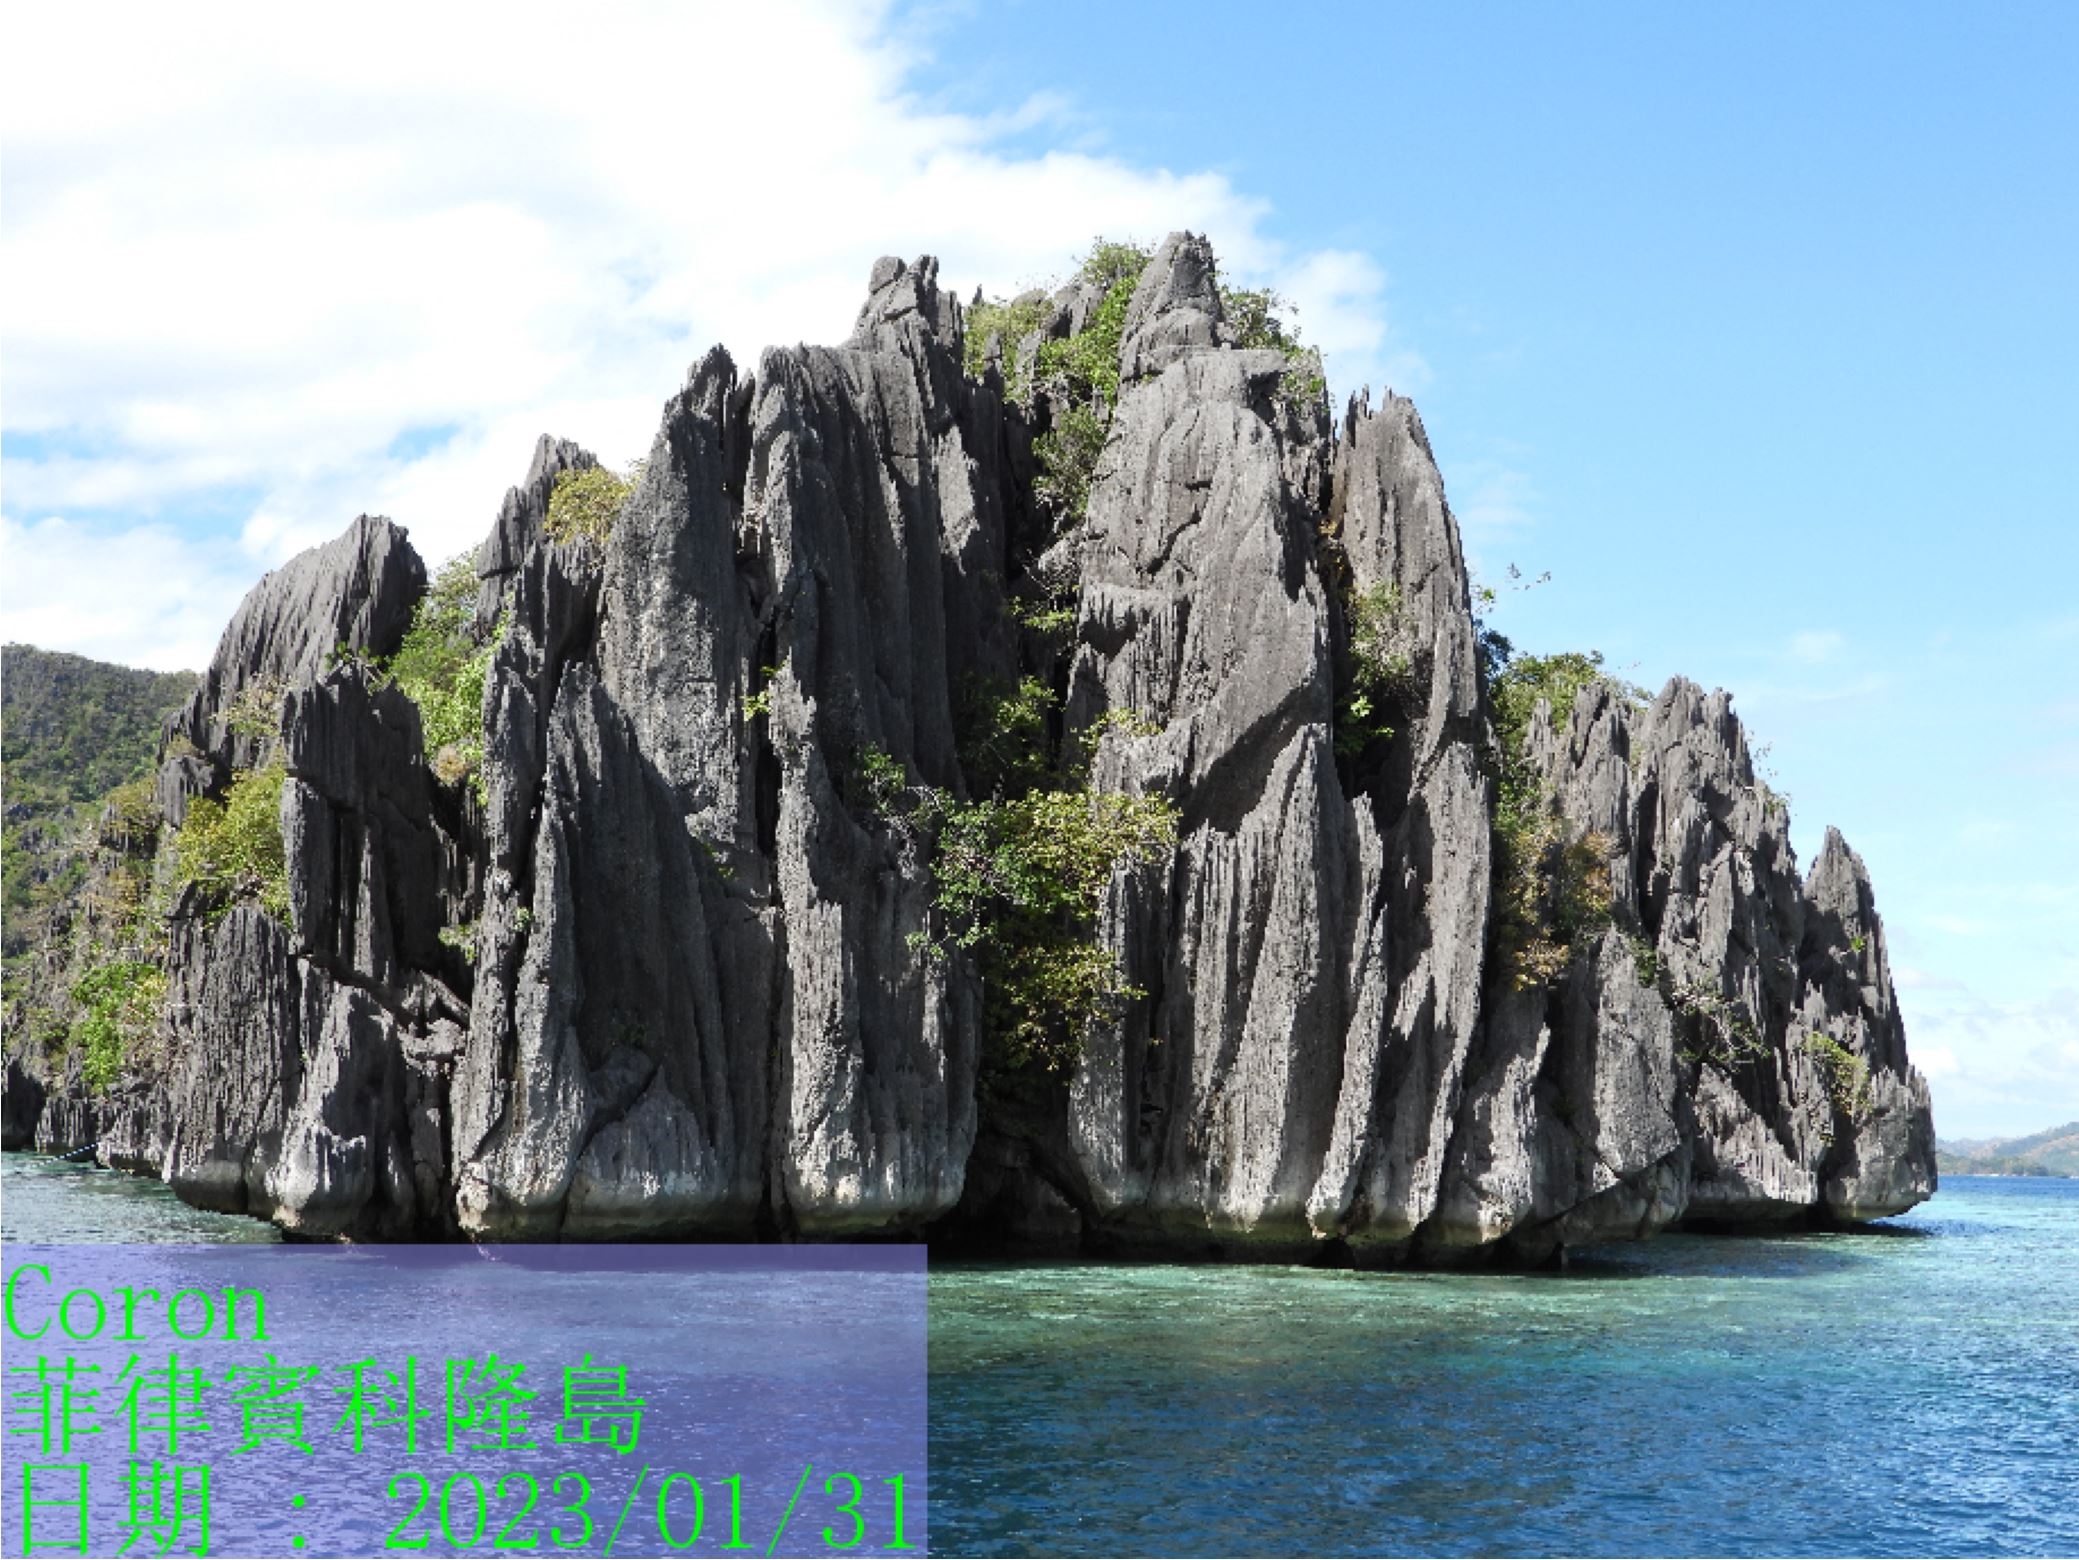
透明矩型-2
Pillow 有直接畫透明矩型的方法,整張圖必需是 RGB 格式,然後使用
draw=ImageDraw.Draw(pil,'RGBA')
將 draw 設定為 RGBA 格式,draw 就可以開始繪制透明矩型。
sdk 程式碼如下
from PIL import Image, ImageDraw, ImageFont
class cv():
    @staticmethod
    def alphaRect(img, text, xy=(0,0), bgcolor=(0,0,0,50), fontcolor=(255,255,255), size=12):
        pil = Image.fromarray(img)
        s=platform.system()
        if s == "Linux":
            font = (
                ImageFont.truetype(
                    '/usr/share/fonts/truetype/wqy/wqy-zenhei.ttc', size)
            )
        elif s=="Darwin":
            font = ImageFont.truetype('....', size)
        else:
            font = ImageFont.truetype('simsun.ttc', size)
        draw=ImageDraw.Draw(pil, 'RGBA')
        x1, y1, x2, y2=draw.textbbox(xy, text=text, font=font)
        x2 += size * 0.3
        y2 += size * 0.3
        draw.rectangle((x1, y1, x2, y2), fill=bgcolor )
        draw.text((x1 + size * 0.2, y1), text, font=font, fill=fontcolor)
        return np.asarray(pil)
主程式碼如下
import pylab as plt
from MahalSdk.cv import cv
img=cv.read("coron.jpg")
txt="Coron\n菲律賓科隆島\n2023/01/31"
img=cv.alphaRect(img, txt, (2,2),bgcolor=(255,150,150,50),fontcolor=(0,255,0),size=200)
cv.imshow(img)
plt.show()