梯度下降的目的
梯度下降逼近法,就是在求損失函數的極小值。但是微分不就可以找極值嗎,為什麼還要多個煩人的梯度下降法。因為簡單的方程式使用微分可以解決,但如果是多次方程式,就可能產生鞍點,這時微分求極值的方法就失效了。
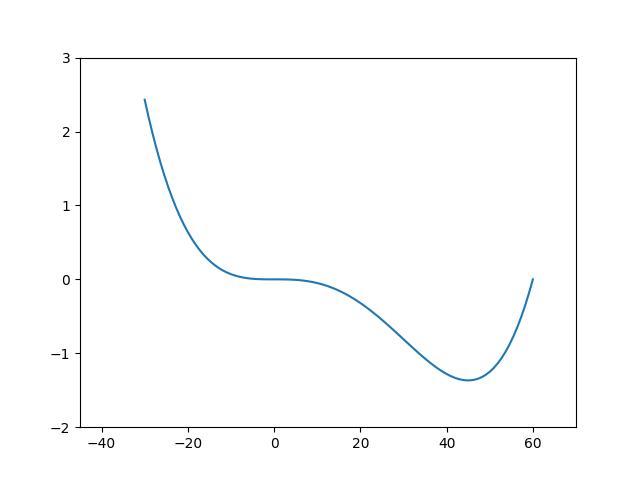
底下是 4 次方程式 $(f(x)=x^{4}-60x^{3}-x+1)$ 所產生的鞍點圖形。
import numpy as np
import pylab as plt
shrink_y=1e6
ax=plt.subplot()
x=np.linspace(-30,60,100)
y=(np.power(x,4)-60*pow(x,3)-x+1)/shrink_y
ax.set_xlim(-45, 70)
ax.set_ylim(-2, 3)
plt.plot(x, y)
plt.savefig("saddle_1.jpg")
plt.show()
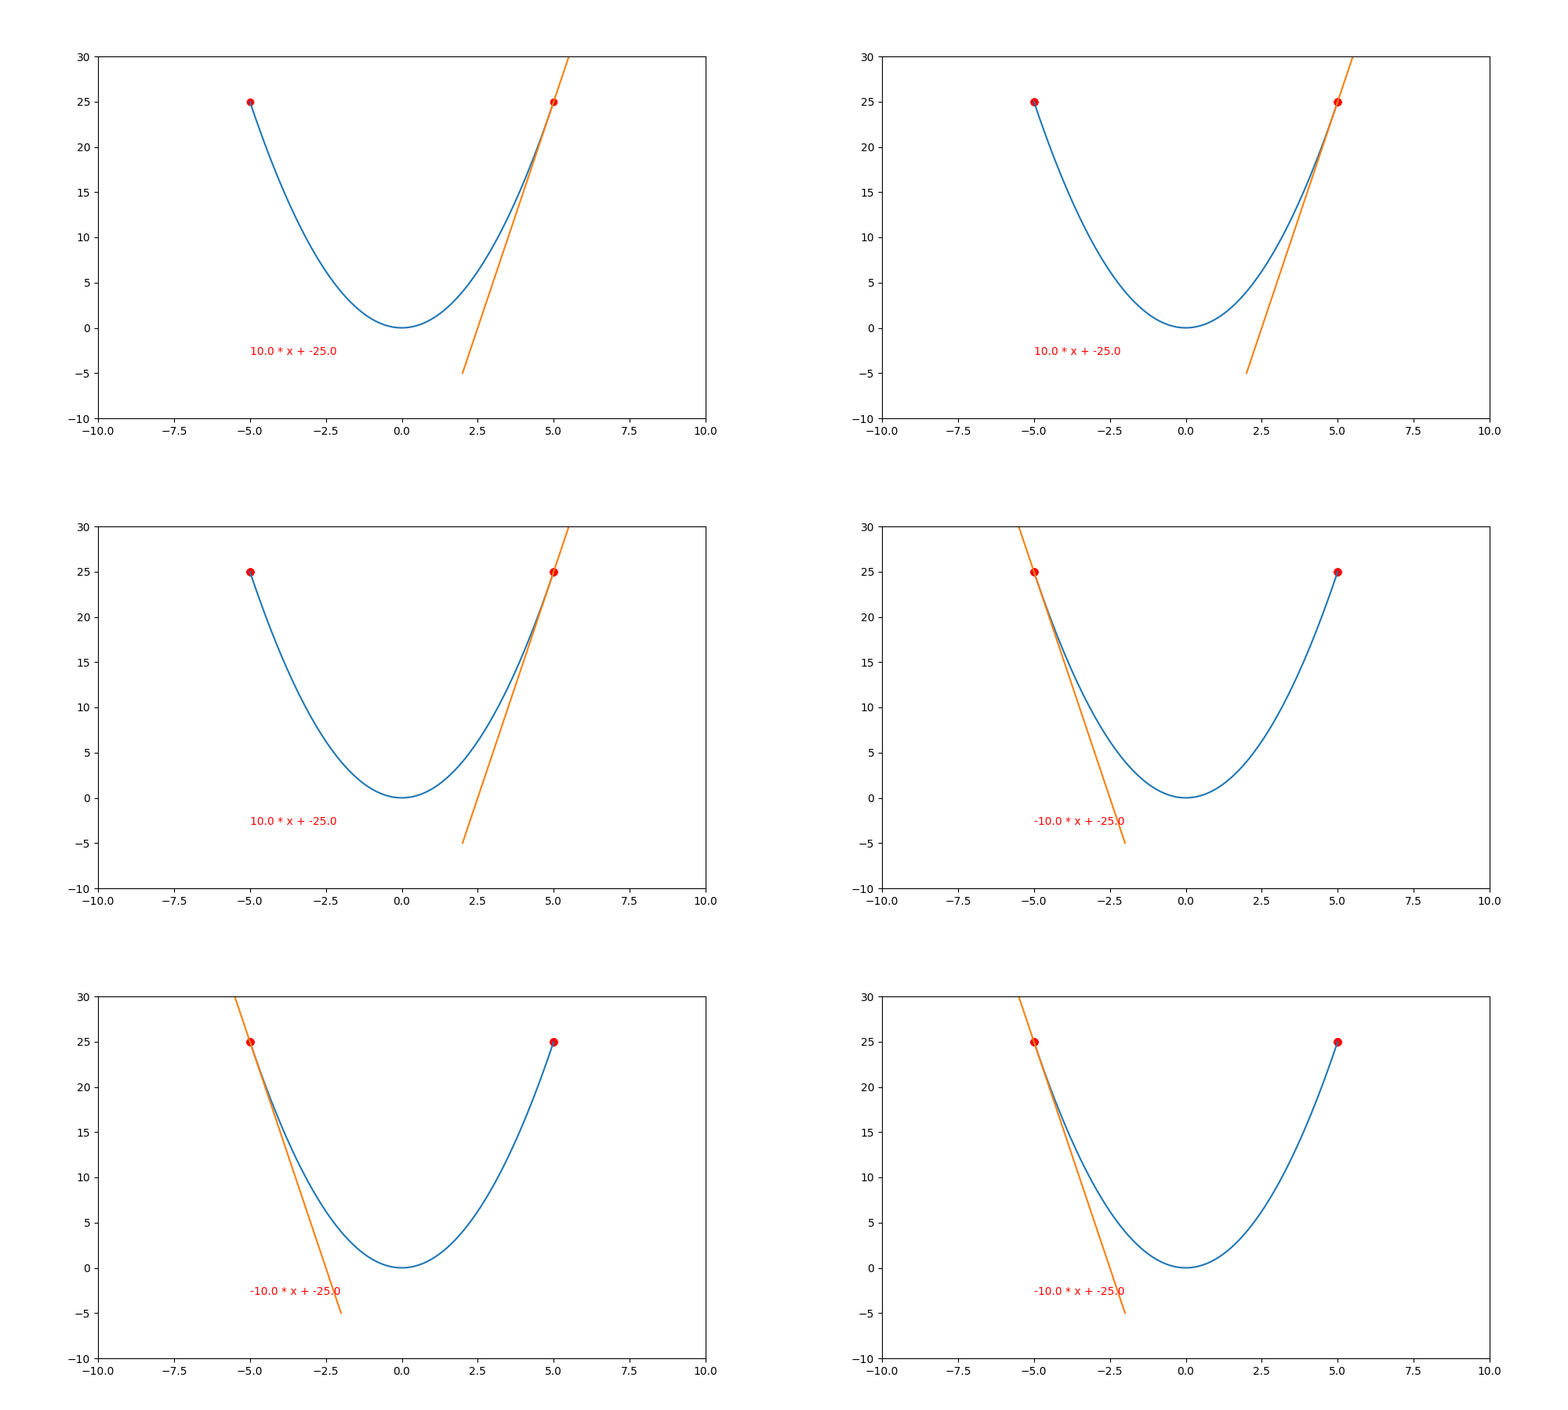
即然微分無法滿足所有方程式的極值求法,那麼就要發明一個可以大小通吃的方法,這就是梯度下降逼近法。此法就是在 x 軸中一小步一小步逼進,進而找到斜率最接近 0 (水平斜率) 時的值。比如在底下的 $(y=x^{2})$ 函數中,要找到 y 的最小值,就必需沿著 x 軸一步一步逼進,求出 f(x) 的微分 $(\bigtriangledown f(x))$ 何時最接近 0 ,進而求出 y 值。
3D鞍點
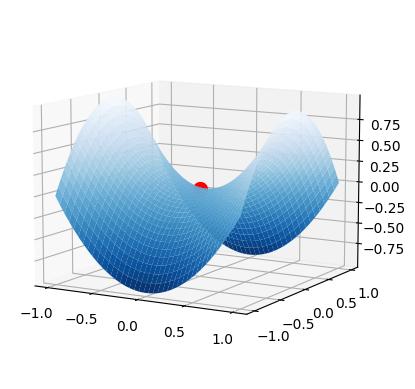
網路上有一個很酷的3D鞍點製作程式,如下代碼所示
from mpl_toolkits.mplot3d import Axes3D
import matplotlib.pyplot as plt
import numpy as np
fig = plt.figure()
ax = fig.add_subplot(111, projection='3d')
x, y = np.mgrid[-1:1:40j, -1:1:40j]
print(x)
print(y)
z = x**2 - y**2
#plot_args不用設定也沒關係,只是設定後圖形比較漂亮
plot_args = dict(
    cmap = "Blues_r",
    linewidth= 0.4,
    alpha =1,
    vmin = -1,
    vmax = 1)
ax.plot([0], [0], [0], 'ro', markersize= 10)
ax.plot_surface(x, y, z, **plot_args)
ax.view_init(azim=-60, elev=10)
plt.show()
批次梯度下降法(Batch Gradient Descent : BGD)
BGD 是最基本的梯度下降法,一般是使用 $(x_{t+1} = x_{t} – f'(x_t)*\bigtriangledown x)$ 來逼近,$(f'(x_t))$ 是 y 函數在 $(x_t)$ 時的微分(斜率)。 $(\bigtriangledown x)$ 的值非常小,通常會是在 $(1*10^{-6})$ 左右。
因為 $(\bigtriangledown x)$ 在電腦上不好顯示,所以用 lr 來表示。也就是說 $(\bigtriangledown x)$ = lr,所以公式會變成 $(x_{t+1} = x_{t} – f'(x_t) * lr)$,我們把 lr 稱為學習率,其實就是 x 軸的步進值。
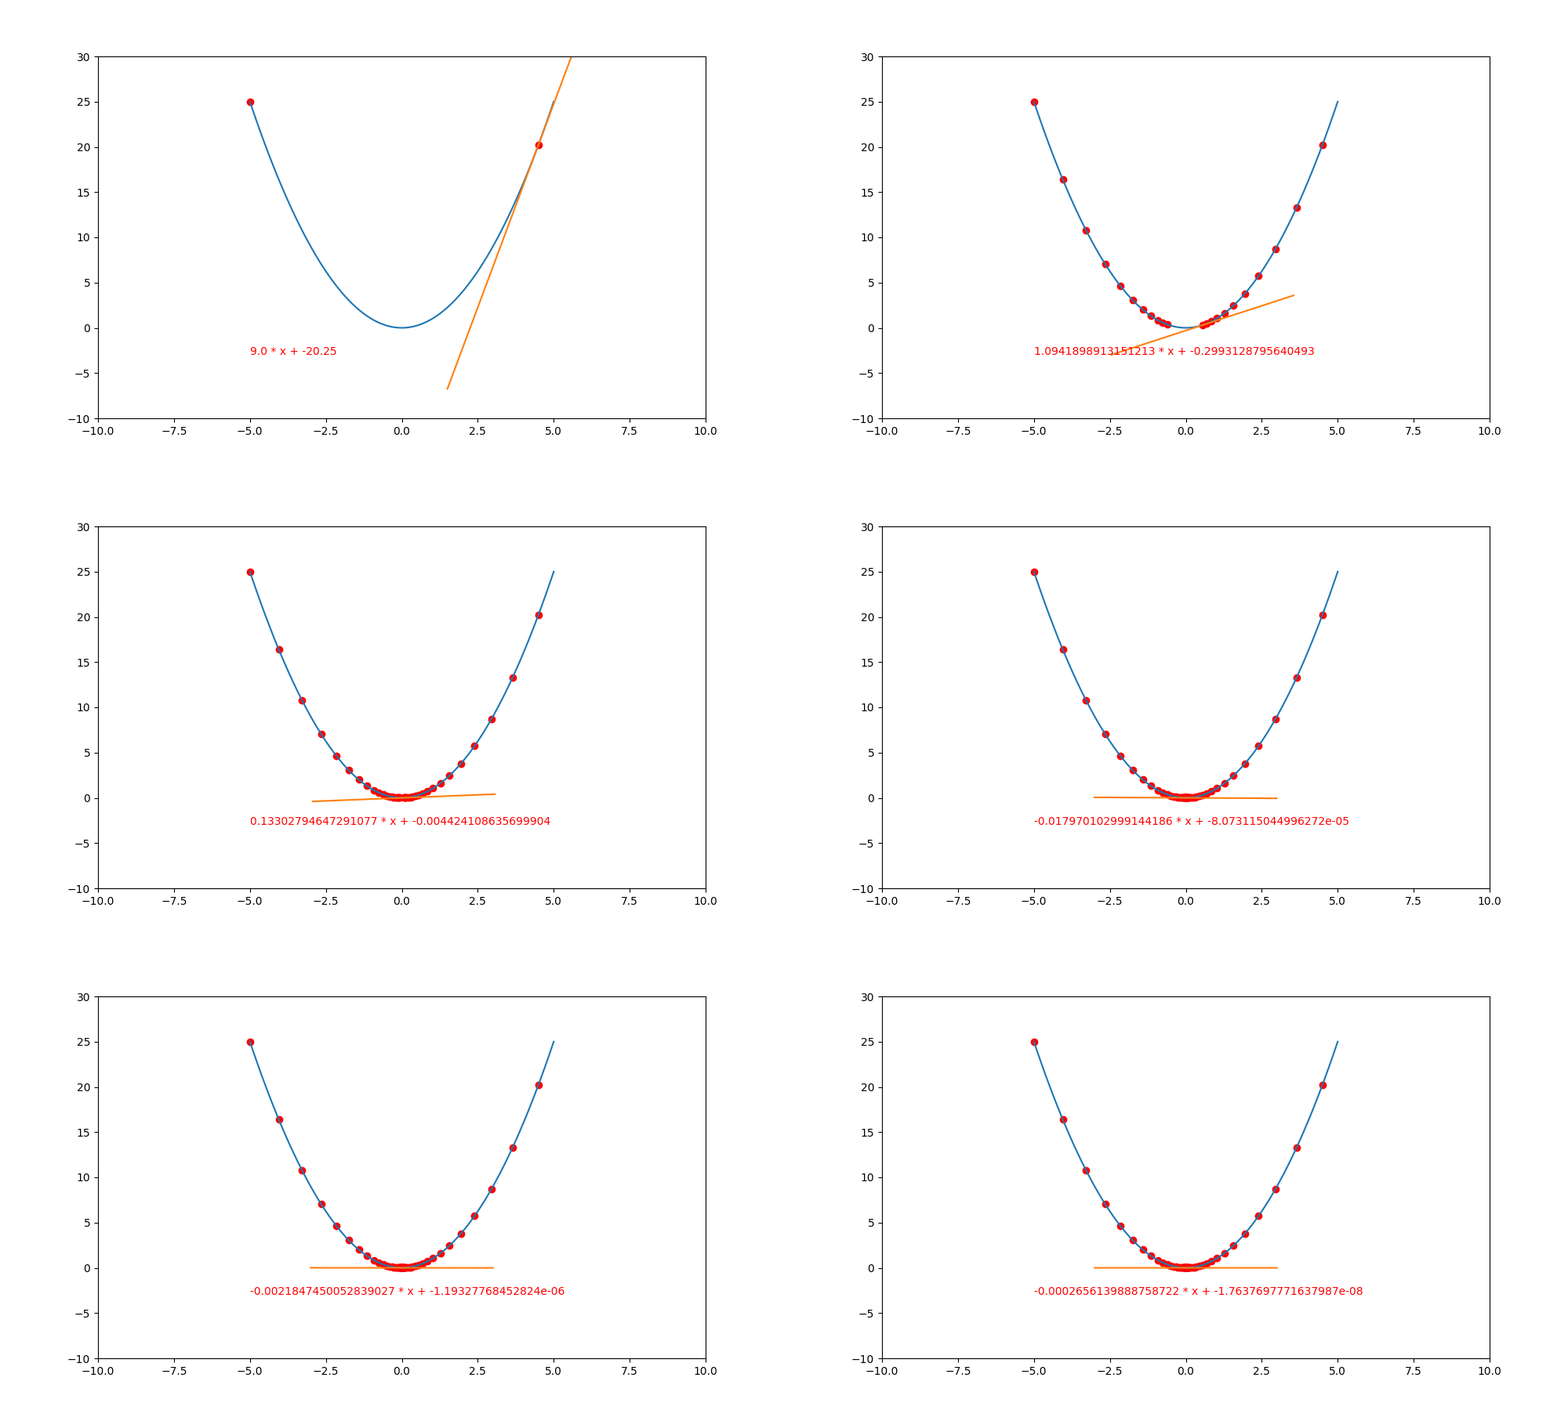
所以說白了,$(f'(x_t) * lr)$ 就是 x 軸下一次的 “步進值”。如下的代碼用圖解的方式來表達。
import numpy as np
import matplotlib.pyplot as plt

#目標函數 y=x^2
def f(x):
    #注意,不可以寫成 return x**2
    return np.square(x)+2

#目標函數的一階導數 dy/dx=2*x
def df(x):
    return 2 * x

def bias(a,x):
    #斜率為 y = ax + b, 此函數在 x 時,值為 f(x)
    #所以 ax + b = f(x), 因此 b = f(x) - ax
    b=f(x) - a * x
    return b

epochs = 80
lr = 0.2
fig=plt.figure(figsize=(9,6))
ax=fig.subplots()

x = np.linspace(-5, 5, 100)
current_x=-5
y=f(x)
traces=[current_x]
for i in range(epochs):
    ax.clear()
    ax.set_xlim(-10,10)
    ax.set_ylim(-2, 35)
    ax.plot(x, y, c='b')
    ax.scatter(traces, f(traces), c='r')

    #對目標函數進行微分
    a=df(current_x)
    b=bias(a, current_x)

    #畫導線
    x_l=current_x-3
    x_r=current_x+3
    line_x=[x_l, x_r]
    line_y = [a * (x_l) + b, a * (x_r) + b]
    ax.plot(line_x, line_y, c='orange')
    ax.text(-2,0, f'y={a:.7f} * x + {b:.7f}', color='red')

    #計算下一步 (x,y)
    current_x = current_x - a * lr
    traces.append(current_x)
    plt.pause(0.01)
plt.show()
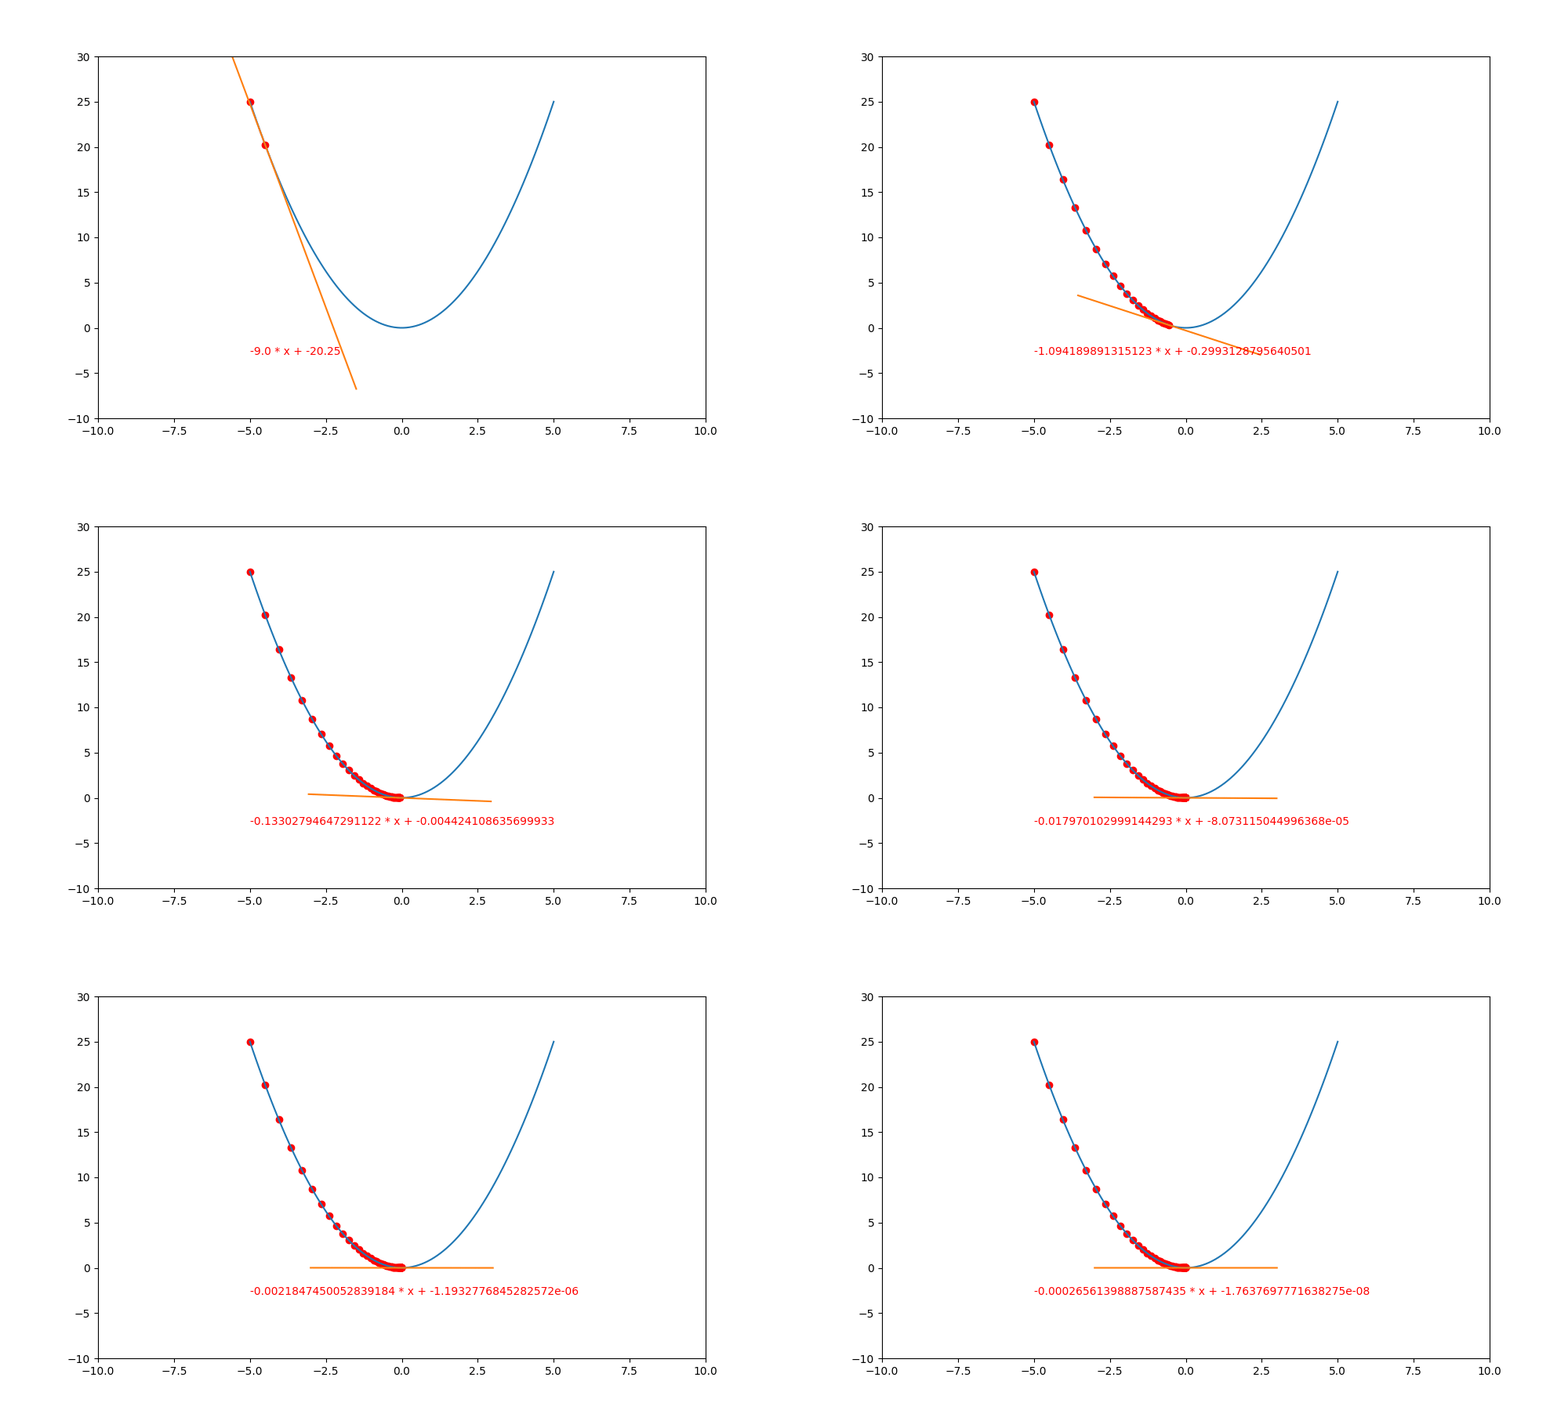
這裏有一個很怪異的問題,為什麼負斜率逐漸變成水平後,不會再度變成正斜率再度往上爬升呢? 這是因為 $(\bigtriangledown f(x) \rightarrow 0)$ ,然後再乘上極小的 lr ,就更加接近 0 。
也因如此, $(y = y + lr * \bigtriangledown f(x) \doteq y + 0 \doteq y)$,所以 y 就會停留在原本的位置,不會繼續往上爬升。
Tensorflosw 版
底下是使用 Tensorflow 的版本
import numpy as np
import matplotlib.pyplot as plt
import tensorflow as tf

#目標函數 y=x^2
def f(x):
    return np.square(x)+2

#計算偏移量 b 值
def bias(a,x):
    b=f(x)- a * x
    return b

epochs = 100
lr = 0.2
ax=plt.subplot()
x = tf.linspace(-5, 5, 100)
current_x=tf.Variable(-5.)#x不可以使用 tf.constant, 一定要用 Variable
traces_x=[current_x]
for i in range(epochs):
    with tf.GradientTape() as tape:
        s = tf.pow(current_x, 2)
    ax.clear()
    ax.set_xlim(-10,10)
    ax.set_ylim(0, 35)
    ax.plot(x, f(x))
    ax.scatter(traces_x, f(traces_x), c='r')

    #進行微分
    a=tape.gradient(s,current_x)
    b=bias(a, current_x)

    #繪製導線
    xl=current_x-3
    xr=current_x+3
    yl = a * xl + b
    yr = a * xr + b
    ax.plot([xl, xr], [yl, yr])
    ax.text(-5, -15, f'{a} * x + {b}', color='red')
    plt.pause(0.01)

    #計算下一步 (x, y)
    current_x = tf.Variable(current_x - a * lr)
    traces_x.append(current_x)
plt.show()
放大學習率
將上述的程式碼中,把 lr 更改為 0.95 ,就會看到導線左右二邊跳動。
..........
xs = np.linspace(-5, 5, 100)
ys = f(xs)
epochs = 200
lr = 0.95
ax=plt.subplot()
t=threading.Thread(target=runnable)
t.start()
plt.show()
過大的學習率
接下來把學習率 lr 改成 1.0,會發現導線在左右二邊持續跳動,根本就無法收斂。
