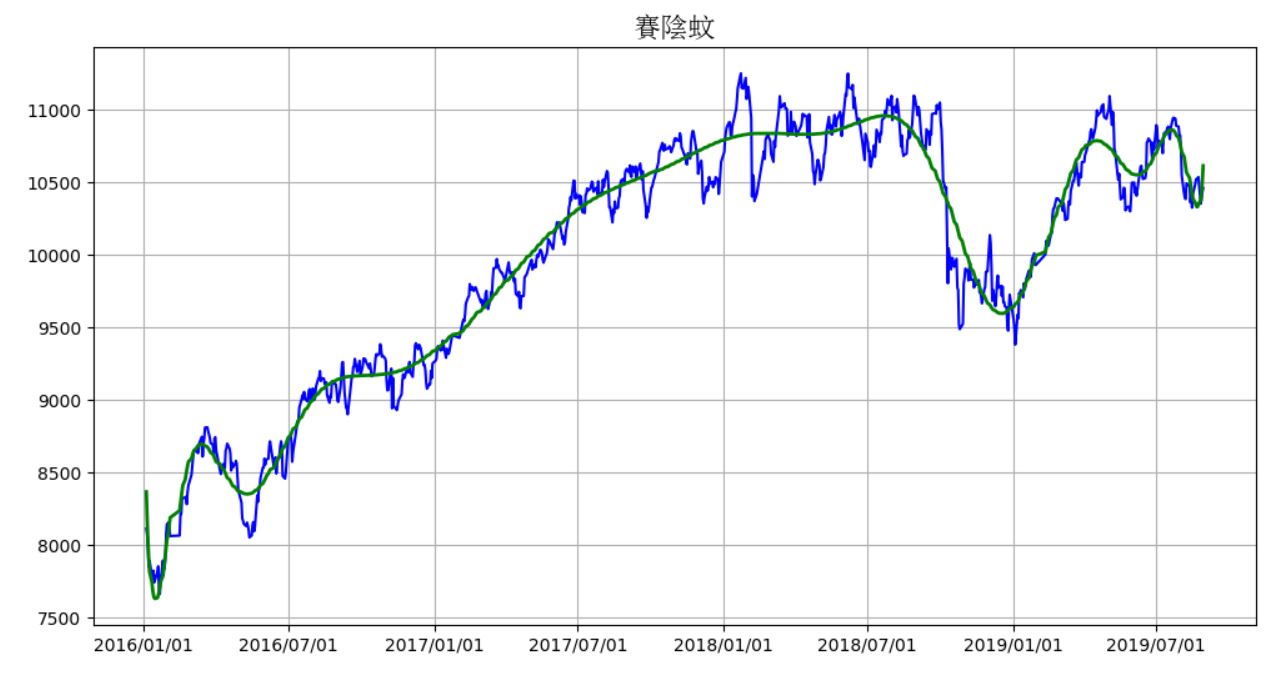
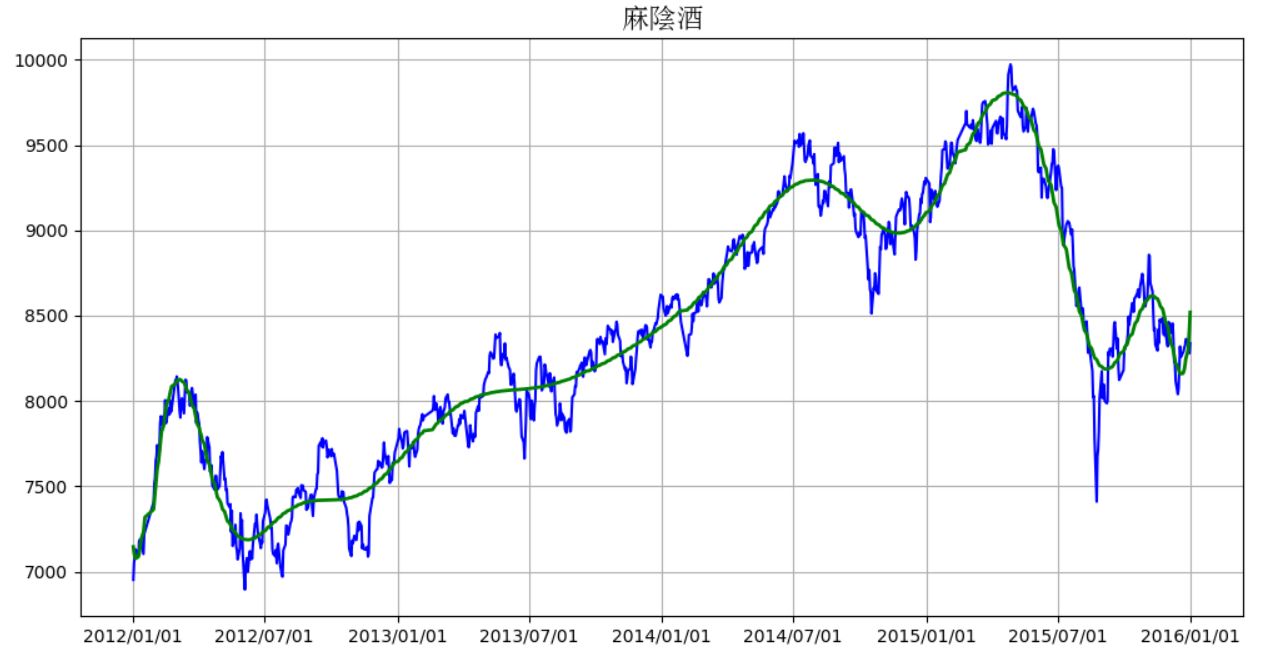
安裝套件
本例需安裝套件
pip install requests mysql-connector-python
資料庫格式
本範例會抓取台灣証券交易所每日股市指數,其資料庫格式如下,請在 workbench 執行如下 SQL 語法
use cloud;
drop table IF EXISTS 台灣股市;
CREATE TABLE `台灣股市` (
  `id` int(11) NOT NULL AUTO_INCREMENT,
  `日期` date NOT NULL,
  `開盤` double DEFAULT NULL,
  `最高` double DEFAULT NULL,
  `最低` double DEFAULT NULL,
  `收盤` double DEFAULT NULL,
  PRIMARY KEY (`id`),
  UNIQUE KEY `日期_UNIQUE` (`日期`)
) ENGINE=InnoDB DEFAULT CHARSET=utf8mb4 COLLATE=utf8mb4_0900_ai_ci;
快速爬取
台灣証券交易所為了使用 Ajax 取得某月的資料,隱藏一段網址,可以用 get 方式取得資料。
請進入 https://www.twse.com.tw/zh/indices/taiex/mi-5min-hist.html 然後按下 F12,選取 Network/Fetch XHR/Preview,然後查詢其它月份的資料時,就會在 Name 欄中取得了資料。切回 Headers,就可以找到 Request URL。這個 URL 就是 Ajax 的網址。經查詢網址如下 :
舊版本 : https://www.twse.com.tw/indicesReport/MI_5MINS_HIST?response=json&date=20220501
新版本 : https://www.twse.com.tw/rwd/zh/TAIEX/MI_5MINS_HIST?date=20241001&response=json
其中的 date 需傳入 “年月日”,日期直接輸入 “01”即可。輸出的結果如下
{"stat":"OK","title":"111年05月 發行量加權股價指數歷史資料",
"date":"20220501","fields":["日期","開盤指數","最高指數","最低指數","收盤指數"],
"data":
[["111/05/03","16,593.21","16,604.87","16,465.99","16,498.90"],
["111/05/04","16,531.37","16,617.06","16,514.30","16,565.83"],
["111/05/05","16,689.98","16,783.78","16,650.81","16,696.12"],
["111/05/06","16,491.11","16,491.11","16,312.17","16,408.20"],
["111/05/09","16,345.84","16,345.84","16,048.92","16,048.92"],
["111/05/10","15,891.40","16,071.50","15,734.44","16,061.70"],
["111/05/11","16,053.75","16,081.15","15,953.27","16,006.25"],
["111/05/12","15,943.62","15,943.62","15,616.68","15,616.68"]]}
上述的資料為 JSON 格式,所以需使用 json.loads 轉成 Python 的字典格式。使用此網址取得資料時,必需在每次爬取時,延遲 3~5 秒,否則一定會被鎖IP。一但被鎖,需經過 2 個小時才會解鎖。
完整代碼
完整代碼如下。
#!/usr/bin/python3
import json
import random
import time
from datetime import datetime
import requests
import mysql.connector as mysql
def getData(year, month):
    url =
f"https://www.twse.com.tw/rwd/zh/TAIEX/MI_5MINS_HIST?date={year:04d}{month:02d}01&response=json"
    page = requests.get(url)
    page.encoding="utf-8"
    rows = json.loads(page.text)["data"]
    data = []
    for row in rows:
        ds = row[0].split("/")
        data.append([f'{int(ds[0]) + 1911}/{ds[1]}/{ds[2]}',
                   float(row[1].replace(",", "")),
                   float(row[2].replace(",", "")),
                   float(row[3].replace(",", "")),
                   float(row[4].replace(",", ""))])
    return data
conn=mysql.connect(
    host="localhost",
    user="帳號",
    password="密碼",
    database="cloud"
)
cursor=conn.cursor()
cmd="insert into 台灣股市 (日期, 開盤, 最高, 最低, 收盤) values (%s, %s, %s, %s, %s)"
now=datetime.now()
for year in range(1999, now.year+1):
    for month in range(1,13):
        if year == now.year and month > now.month:
            break
        print(f"正在爬取 {year}/{month:02d} 資料.....")
        data=getData(year,month)
        cursor.executemany(cmd, data)
        conn.commit()
        time.sleep(3+random.random())
conn.close()
yfinance
yfinance 是由 yahoo 開發出來的套件,此套件直接讀取 yahoo 的股市資料庫,所以嚴格上來說,這種方法不屬於爬蟲程式,但卻是一個很方便的工具,也不會因為讀取頻繁而被鎖 IP。
本例需安裝套件
pip install yfinance
使用 yf.download(股票代號, 啟始日期, 結束日期, auto_adjust=True) 就會傳回 Pandas 的 DataFrame 格式資料,內容有每日的開盤價、最高、最低、收盤價、成交量。
auto_adjust 是調整後收盤價,意思是在收盤後到第二天開盤前,若有任何分配、股息、股票分割等行為時進行調整。True 不顯示,False 則會顯示,預設為 False.
import yfinance as yf
from datetime import datetime
import pandas as pd
display=pd.options.display
display.max_columns=None
display.max_rows=None
display.width=None
display.max_colwidth=None
stock='GC=F'
current=datetime.now()
df = yf.download(stock, '1970-01-01', current, auto_adjust=True)
print(df)

結果:
[*********************100%%**********************]  1 of 1 completed
                   Open         High          Low        Close  Volume
Date
2000-08-30   273.899994   273.899994   273.899994   273.899994       0
2000-08-31   274.799988   278.299988   274.799988   278.299988       0
2000-09-01   277.000000   277.000000   277.000000   277.000000       0
2000-09-05   275.799988   275.799988   275.799988   275.799988       2
...........................
股票代號可以到 https://tw.stock.yahoo.com/ 查詢,輸入股票名稱即可取得股票代號,比如輸入台積電,則可查得代號為 : 2330.TW
比較難查詢到的代號如下
大盤指數 : ^TWII
黃金期貨 : GC=F (黃金期貨以美元計價)。
finance 資料庫
底下的完整代碼,可以把 stocks 裏的股票代碼儲存到 finance 資料庫中。
from datetime import datetime
from G import G
import mysql.connector as mysql
import yfinance as yf
import pylab as plt
conn=mysql.connect(
    host=G.host,
    user=G.user,
    password=G.password,
    database=G.database
)
cursor=conn.cursor()
current=datetime.now()
stocks={
    "大盤":"^TWII",
    "黃金期貨":"GC=F",
    "台積電":"2330.TW",
    "聯發科": "2454.TW",
    #"仁寶":"2324.TW",
    "英業達":"2356.TW",
    "廣達":"2382.TW",
    "鴻海":"2317.TW",
    "台塑":"1301.TW",
    "中鋼":"2002.TW",
    "致伸":"4915.TW",
    "群聯":"8299.TWO",
    "矽格":"6257.TW",
}
plt.rcParams['font.sans-serif'] = ['Microsoft JhengHei']
fig, ax=plt.subplots(3,4)
fig.suptitle("2024年")
for i, stock in enumerate(stocks):
    print(f"下載 {stock} ......")
    df = yf.download(stocks[stock], "1970-01-01", current, auto_adjust=True)
    if df.shape[0]>0:
        cmd=f"drop table if exists {stock}"
        cursor.execute(cmd)
        conn.commit()
        cmd =f'''
        CREATE TABLE `{stock}` (
          `id` int NOT NULL AUTO_INCREMENT,
          `Date` date NOT NULL,
          `Open` double NOT NULL,
          `High` double NOT NULL,
          `Low` double NOT NULL,
          `Close` double NOT NULL,
          `Volume` bigint NOT NULL,
          PRIMARY KEY (`id`),
          UNIQUE KEY `Date_UNIQUE` (`Date`)
        ) ENGINE=InnoDB AUTO_INCREMENT=1
        DEFAULT CHARSET=utf8mb3 COLLATE=utf8mb3_unicode_ci
        '''
        cursor.execute(cmd)
        conn.commit()

        #d=[str(d).split("T")[0] for d in df.index.values]
        df.insert(0, "Date", df.index)
        data=df.values.tolist()
        cmd=f"insert into {stock} (Date, Open, High, Low, Close, Volume) values (%s, %s, %s, %s, %s, %s)"
        cursor.executemany(cmd, data)
        conn.commit()
        df=df.query("Date>='2024-01-01'")
        row=int(i/4)
        col=i-row*4
        ax[row][col].plot(df['Date'], df['Close'])
        ax[row][col].set_title(stock)
        ax[row][col].set_xticklabels([])
conn.close()
plt.show()
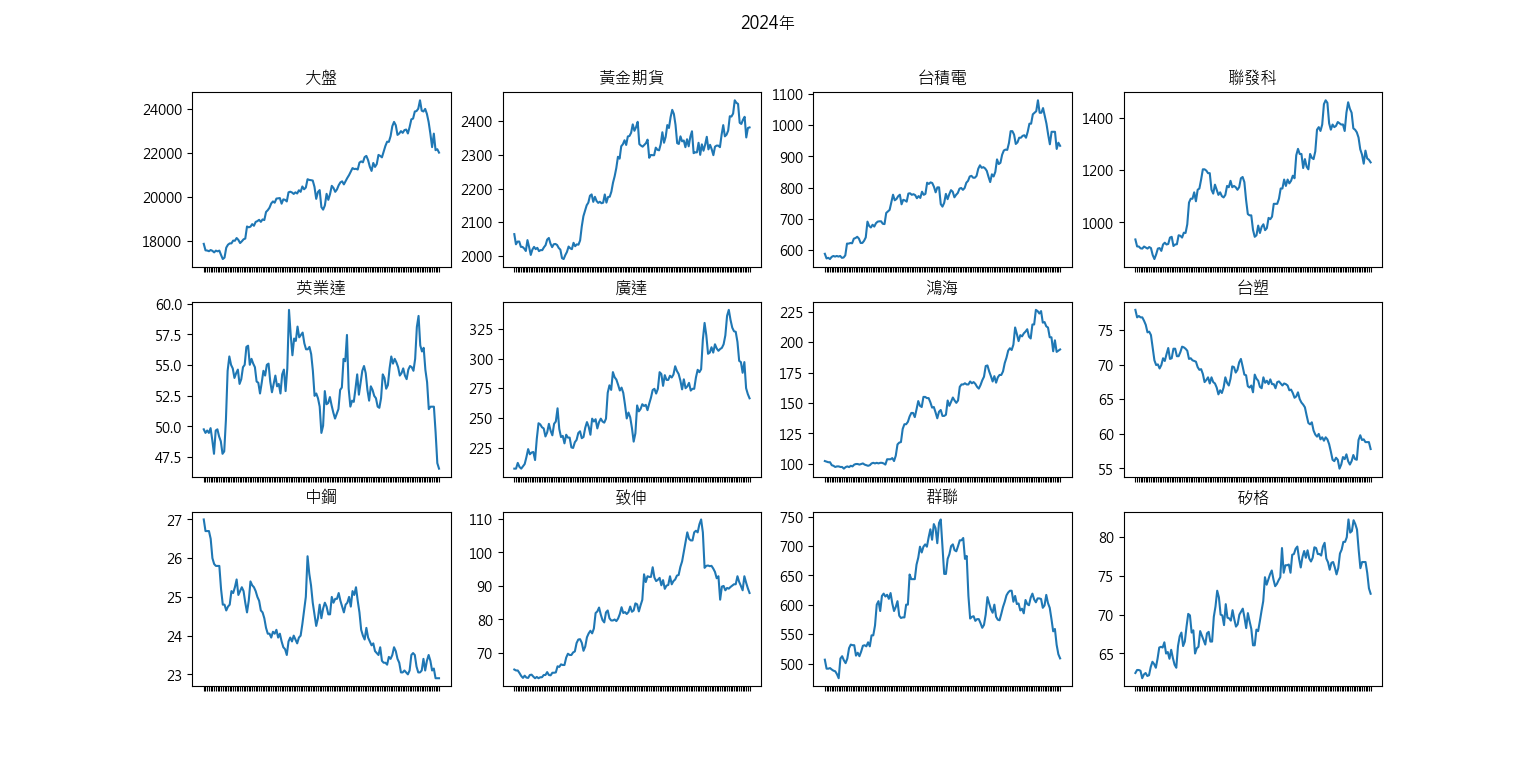
plotly 子繪圖區
底下是使用 plotly 子繪圖區分析每檔股票的走勢圖
from datetime import datetime
import plotly
from plotly.subplots import make_subplots
import plotly.graph_objects as go
from G import G
import mysql.connector as mysql
import yfinance as yf
conn=mysql.connect(
    host=G.host,
    user=G.user,
    password=G.password,
    database=G.database
)
cursor=conn.cursor()
current=datetime.now()
stocks={
    "大盤":"^TWII",
    "黃金期貨":"GC=F",
    "台積電":"2330.TW",
    "聯發科": "2454.TW",
    "英業達":"2356.TW",
    "廣達":"2382.TW",
    "鴻海":"2317.TW",
    "台塑":"1301.TW",
    "中鋼":"2002.TW",
    "致伸":"4915.TW",
    "群聯":"8299.TWO",
    "矽格":"6257.TW",
}
fig=make_subplots(
    rows=4, cols=3,
    subplot_titles=list(stocks.keys()),
)
for i, stock in enumerate(stocks):
    print(f"下載 {stock} ......")
    df = yf.download(stocks[stock], "1970-01-01", current, auto_adjust=True)
    if df.shape[0]>0:
        cmd=f"drop table if exists {stock}"
        cursor.execute(cmd)
        conn.commit()
        cmd =f'''
        CREATE TABLE `{stock}` (
          `id` int NOT NULL AUTO_INCREMENT,
          `Date` date NOT NULL,
          `Open` double NOT NULL,
          `High` double NOT NULL,
          `Low` double NOT NULL,
          `Close` double NOT NULL,
          `Volume` bigint NOT NULL,
          PRIMARY KEY (`id`),
          UNIQUE KEY `Date_UNIQUE` (`Date`)
        ) ENGINE=InnoDB AUTO_INCREMENT=1
        DEFAULT CHARSET=utf8mb3 COLLATE=utf8mb3_unicode_ci
        '''
        cursor.execute(cmd)
        conn.commit()

        #df.insert(0, "Date", df.index)
        df = df[df.index >= pd.Timestamp("2024-01-01")]  # 修正篩選日期的方式
        data=df.values.tolist()
        cmd=f"insert into {stock} (Date, Open, High, Low, Close, Volume) values (%s, %s, %s, %s, %s, %s)"
        cursor.executemany(cmd, data)
        conn.commit()
        row, col = divmod(i, 3)
        x = df.index.values
        y = df["Close"].values.reshape(-1)
        fig.add_trace(
            go.Scatter(
                x=x,
                y=y,
            ),
            row = row+1,
            col = col+1,
        ).update_xaxes(showticklabels=False)#不顯示 xlabel
conn.close()
fig.update_layout(
    title_text="2024年 台灣個股走勢圖",
    title_x=0.5,#標題置中
    showlegend=False,#不顯示圖例
)
fig.show()
plotly.offline.plot(fig,filename="twstock.html",auto_open=False)
2024年 台灣個股走勢圖
Selenium爬蟲
使用 Selenium 爬取台灣証券資料雖說比較麻煩,所耗資源也比較大,但卻可適用於大部份的網頁。試想証券網若沒有上述的 Ajax 網址,那麼唯一的方法就是使用 Selenium。此網站保護較少,用這個網站了解其中原理最為方便。
請先安裝如下套件
pip install matplotlib BeautifulSoup4 selenium
底下代碼, 可將前一個月及本月的每日大盤指數儲存到mysql資料庫中,完整代碼如下
#!/usr/bin/python3
import datetime
import time, random
from selenium import webdriver
from selenium.webdriver.chrome.service import Service
from selenium.webdriver.support.ui import Select
from selenium.webdriver.common.by import By
from selenium.webdriver.support.ui import WebDriverWait
from selenium.webdriver.support import expected_conditions as EC
from selenium.webdriver.chrome.options import Options
from webdriver_manager.chrome import ChromeDriverManager
import mysql.connector as mysql
from bs4 import BeautifulSoup
from G import G
def getStock(yyyy, mm):
    select = Select(browser.find_element(By.NAME,"yy"))
    select.select_by_value(str(yyyy))
    select = Select(browser.find_element(By.NAME,"mm"))
    select.select_by_value(str(mm))
    btn = browser.find_element(By.CLASS_NAME,"button")
    btn.click()
    rows=[]
    try:
        WebDriverWait(browser, 20).until(EC.presence_of_element_located((By.TAG_NAME, "td")))
        soup=BeautifulSoup(browser.page_source,'html.parser')
        trs=soup.find_all('tr', role='row')
        for i in range(1, len(trs)):
            tds=trs[i].find_all('td')
            ds=tds[0].text.split("/")
            rows.append(
                [f'{int(ds[0]) + 1911}-{ds[1]}-{ds[2]}',
                 float(tds[1].text.replace(",", "")),
                 float(tds[2].text.replace(",", "")),
                 float(tds[3].text.replace(",", "")),
                 float(tds[4].text.replace(",", ""))]
            )
        time.sleep(random.randint(3,5)+random.random())
    except Exception as e:
        print(e.message)
    return rows

opt = Options()
opt.add_argument('--headless')
opt.add_argument('--disable-gpu')
opt.add_experimental_option('detach', True)
service=Service(ChromeDriverManager().install())
browser = webdriver.Chrome(service=service, options=opt)
browser.get("https://www.twse.com.tw/zh/page/trading/indices/MI_5MINS_HIST.html")
conn=mysql.connect(host=G.ip,user=G.account, password=G.password, database=G.db)
cursor = conn.cursor()
cmd="insert into 台灣股市 (日期, 開盤, 最高, 最低, 收盤) values (%s, %s, %s, %s, %s)"
current=datetime.datetime.now()

#底下是取得前一個月跟本月份的股市
if current.month>1:
    months=[current.month-1, current.month]
else:
    months=[current.month]

for m in months:
    print(f'Getting Taiwan Stock for {current.year}/{m:02d}...')
    rows=getStock(current.year, m)
    if len(rows)>0:
        cursor.execute(f"delete from 台灣股市 where 日期 like '{current.year}-{m:02d}%'")
        conn.commit()
        cursor.executemany(cmd, rows)
        conn.commit()
cursor.close()
conn.close()
讀取資料庫分析
import pylab as plt
from matplotlib.font_manager import FontProperties
from datetime import datetime
import matplotlib.dates as mdates
import mysql.connector as mysql
conn=mysql.connect(host="ip",user="account", password="pwd", database="db")
warehouse = {}
d=datetime.now()
cmd="select * from 台灣股市 where 日期 >= '2016/01/01' and 日期<='{0}/{1}/{2} order by 日期'".format(d.year, d.month, d.day)
cursor=conn.cursor()
cursor.execute(cmd)
rows=cursor.fetchall()
x=[]
y=[]
dates=[]
for i, row in enumerate(rows):
    y.append(row[5])
    x.append(i)
    dates.append('{0}'.format(row[1]))
x_date = [datetime.strptime(i, '%Y-%m-%d').date() for i in dates]
font = FontProperties(fname=r"C:/WINDOWS/Fonts/simsun.ttc", size=16)
plt.figure(figsize=(12,6))
plt.title("賽陰蚊", fontproperties=font)
plt.gca().xaxis.set_major_formatter(mdates.DateFormatter('%Y-%m-%d'))
plt.plot(x_date,y, color='blue')
f=plt.poly1d(plt.polyfit(x, y, 20))
plt.plot(x_date, f(x), color='green', linewidth=2)
plt.grid()
plt.show()