Bokeh
bokeh[ˈbəʊkeɪ]散景,類似matplotlib的繪圖方式,傳入x, y的值,然後以網頁的方式呈現出圖表。
看過台股大盤指數技術分析嗎, 裏面的圖表是可以左右移動的, 請進入 https://tw.stock.yahoo.com/t/idx.php 自行測試看看
這種內崁網頁的圖表, 很明顯的, 是採用javascript撰寫而成的, 專業吧!! No~~一點也不, 因為我們也可以.
Bokeh可以讓圖表呈現動態的樣子, 可用滑鼠拖曳或縮放
安裝
pip install bokeh
簡易測試
#!/usr/bin/python3
from bokeh.io import show
from bokeh.plotting import figure, output_file
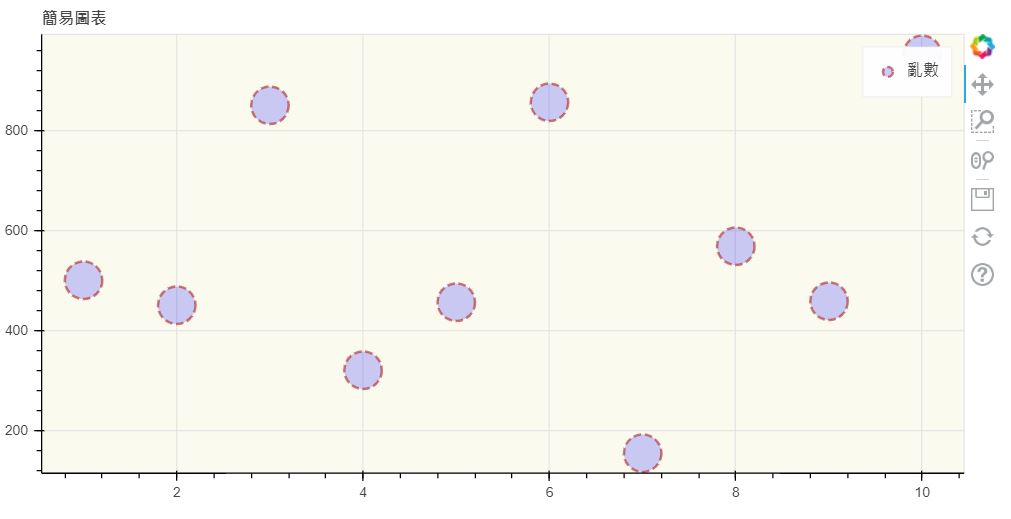
p=figure(width=800, height=400, title='簡易圖表')
x = list(range(1,11))
y = [500,450,850,320,456,856,154,568,458,952]
p.background_fill_color = "beige"
p.background_fill_alpha = 0.5
#p.legend.location = "bottom_left" #新版已無用了
circle=p.scatter(x,y,size=20, color='blue',alpha=0.6)

#更改圓型樣式,glyph[glɪf]象型文字,縱溝紋
glyph=circle.glyph
glyph.size = 30
glyph.fill_alpha = 0.2
glyph.line_color = "firebrick"
glyph.line_dash = [6, 3]
glyph.line_width = 2
output_file("bokeh_simple.html")
show(p)
下圖可使用滑鼠移動及縮放

php 執行Python
底下是在Linux下, 由php啟動python的方法
system('python PATH/xxx.py ' (PARAMS));Single Lines
底下的程式碼, 可以從資料庫抓取台股每天的指數, 然後繪制迴歸線
幾個注意事項如下
1. 使用 p.line()繪製
2. x軸改為日期 : 在 p=figure()中, 指定 x_range=FactorRange(factors=d), d為日期list
3. 日期Lable旋轉 : p.xaxis.major_label_orientation = np.pi/4, 設定弳度
#!/usr/bin/python3
import mysql.connector as mysql
from bokeh.plotting import figure, show
from bokeh.models import FactorRange
import numpy as np
import pylab as plt
conn=mysql.connect(host="ip",user="account", password="password", database="db")
cursor=conn.cursor()
cursor.execute("select * from taiex where tx_date>='2018/01/01' order by tx_date")
rows=cursor.fetchall()

d=[row[1].strftime('%Y-%m-%d') for row in rows]
y=[row[3] for row in rows]
p=figure(width=1024, height=400, title='台灣股市',
        x_range=FactorRange(factors=d))
p.xaxis.major_label_orientation = np.pi/4
p.title.text_color='olive'
p.title.text_font_style='italic'
x = list(range(len(values)))
p.line(d,y, color='blue',alpha=0.6, line_width=2)

f=plt.poly1d(plt.polyfit(x,y,20))
line=f(x)
p.line(d,line, color='red',alpha=0.6)

show(p)
新版程式
from datetime import datetime
import yfinance as yf
from bokeh.io import show
from bokeh.models import FactorRange
from bokeh.plotting import figure
current=datetime.now()
df=yf.download("^TWII",'2024-01-01', current, auto_adjust=True)
d=[str(d).split("T")[0] for d in df.index.values]
y=df[["Close"]]
p=figure(width=1024, height=400, title='stock', x_range=FactorRange(factors=d))
p.line(d, y, color="blue", alpha=0.6, line_width=2)
show(p)
長條圖
下面代碼, 繪製台灣黃金價格. 在 p.vbar()中, 指定 bottom=1100, 指定Y軸最低價格, top=y則為實際價格, 另也需指定width=0.5
#!/usr/bin/python3
import mysql.connector as mysql
from bokeh.plotting import figure, show
from bokeh.models import FactorRange
import numpy as np
conn=mysql.connect(host="ip",user="account", password="password", database="db")
cursor=conn.cursor()
cursor.execute("select * from 台銀黃金 where 日期>='2022/01/01' order by 日期")
rs=cursor.fetchall()
y=[]
d=[]
cursor.close()
y=[r[3] for r in rs]
d=[r[1].strftime("%Y-%m-%d") for r in rs]
p=figure(plot_width=800, plot_height=500, title='台灣黃金',x_range=FactorRange(factors=d))
p.xaxis.major_label_orientation = np.pi/4
p.title.text_color='olive'
p.title.text_font_style='italic'
x = list(range(len(rs)))
p.vbar(x=d,top=y, bottom=1100, width=0.5, color='blue',alpha=0.6, line_width=2)
show(p)
細部設定
下面的網站, 詳細的說明了每個參數的設定, 可以參考看看
https://zhuanlan.zhihu.com/p/52039412
