SDK
資料視覺化最近被炒的很火熱, 尤其是Python, 都誇它有多強多厲害. C#圖表視覺化其實從沒缺席. 微軟收購了Dundas這間圖表元件公司, 並將其技術包裝成一個免費的SDK, 稱為 Microsoft Chart Controls .
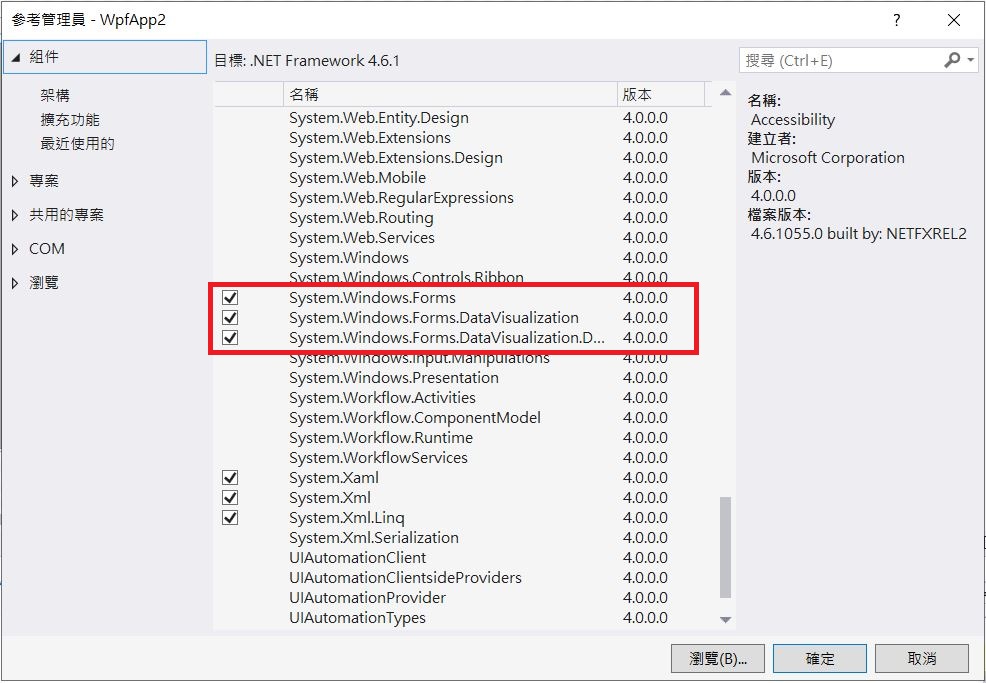
加入參考
圖表的製作, 只要加入下圖的三個參考及另一個.dll檔即可.
不過請注意, 如果還在用 .NetFramework 3.5的話, 就需到微軟的網站下載安裝(本篇不作介紹)

另一個 dll 檔為WindowsFormsIntegration.dll, 位於如下
C:\Program Files\Reference Assemblies\Microsoft\Framework\v3.0\WindowsFormsIntegration.dll
xaml
xaml裏, 將參考的dll加入namespace
xmlns:wfi="clr-namespace:System.Windows.Forms.Integration;assembly=WindowsFormsIntegration"
xmlns:wf="clr-namespace:System.Windows.Forms;assembly=System.Windows.Forms"
xmlns:CHR="clr-namespace:System.Windows.Forms.DataVisualization.Charting;assembly=System.Windows.Forms.DataVisualization"
加入控制項
元件控制項需手動加入, 如下代碼
<Grid>
    <wfi:WindowsFormsHost x:Name="mainFGrid" >
        <CHR:Chart x:Name="mainChart" />
    </wfi:WindowsFormsHost>
</Grid>
相關名詞及觀念
ChartArea : 表示圖表區域, 一個Chart可以繪製多個ChartArea, 重疊在一起.
Series : 表示資料序列, 每個ChartArea可以有多個數據線.
AxisX,AxisY : 表示主座標軸, 每一個ChartArea都有對應的座標軸, 包括主座標軸, 輔座標軸
Queue集合 : 表示先進先出的集合。
簡易繪圖
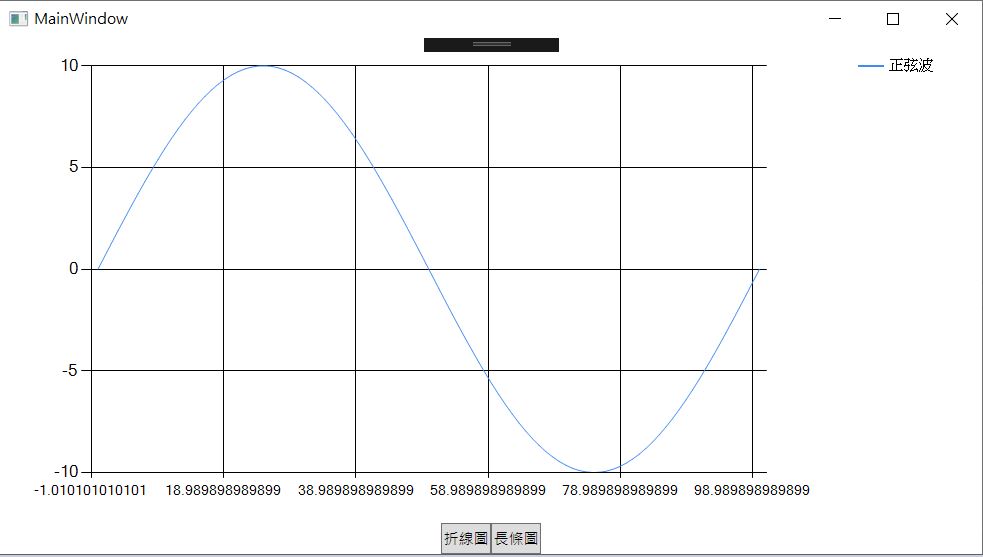
底下為一簡易繪製正弦波的圖表. 先產生一個ChartArea繪圖區域, 然後加入chart這個控制元件.
Series為繪制的數值資料, 需指定要繪圖的區域, 繪製何種圖形, 最後再使用series.Point.BindXY(x, y) 將x軸及 y軸的資料放入. x, y的資料形態可以為陣列, 也可以為List
using System;
using System.Collections.Generic;
using System.Data;
using System.Windows;
using System.Windows.Forms.DataVisualization.Charting;

namespace WpfApp2
{
    public partial class MainWindow : Window
    {
        DataTable dt=new DataTable();
        public MainWindow()
        {
            InitializeComponent();
            InitChart();
        }
        public void InitChart()
        {
            ChartArea ca = new ChartArea("ca");
            chart.ChartAreas.Add(ca);
            //增加圖例說明
            Legend legend = new Legend("legend");
            chart.Legends.Add(legend);
            //ca.Area3DStyle.Enable3D = true;
            Series series = new Series("series");
            //series.ChartType = SeriesChartType.Column;//長條圖
            series.ChartType = SeriesChartType.Line;
            chart.Series.Add(series);
            series.ChartArea = "ca";
            series.Legend = "legend";
            series.LegendText = "正弦波";

            List x = linspace(0, 100, 100);
            List y = new List();
            for (int i = 0; i < x.Count; i++)
            {
                y.Add(10*Math.Sin(2*Math.PI*x[i]));
            }
            series.Points.DataBindXY(x, y);
        }
        public List linspace(double x, double y, int z)
        {
            List l = new List();
            double diff = (y-x)/(z-1);
            double currentValue = x;
            for (int i = 0; i < z; i++)
            {
                l.Add(currentValue);
                currentValue += diff;
            }
            return l;
        }
    }
}

