
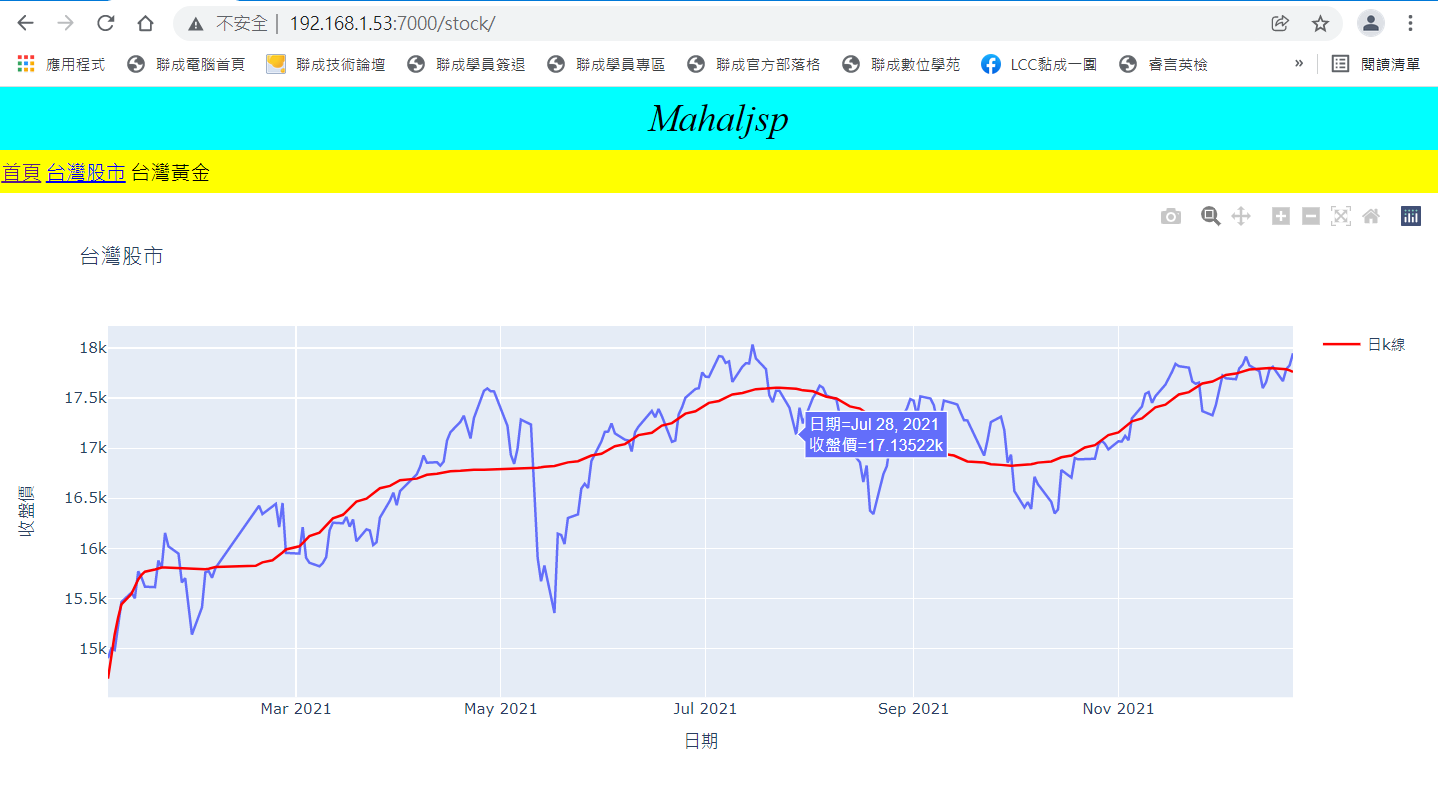
底下的範例,在網站中點選超連結後,就會啟動Python的 plotly-express進行資料視覺化分析,然後直接秀在網頁上。
head.html
<!DOCTYPE html>
<html>
<style>
    body,html{
        height:100%;
        margin:0;
    }
</style>
<head>
    <meta charset="UTF-8">
    <title>MahalJsp</title>
</head>
<body>
    <table width="100%" height="100%" cellspacing="0" cellpadding="0">
        <tr bgcolor="#00ffff" align="center" height="50">
            <td style="font-style:italic;font-size:30px;">Mahaljsp</td>
        </tr>
        <tr bgcolor="#ffff00"height="35">
            <td>
                <table>
                    <tr>
                        <td><a href="/">首頁</a></td>
                        <td><a href="/stock">台灣股市</a></td>
                        <td>台灣黃金</td>
                    </tr>
                </table>
            </td>
        </tr>
        <tr>
            <td>
tail.html
            </td>
        </tr>
    </table>
</body>
</html>
stock.html
{% include "head.html" %}
<style>
    //底下的div用不到,只是註記而以
    div{
        background-color:#aaaaff;
        height:100%;
        width:100%;
        text-align:center;
        margin: 0;
        display: flex;
        justify-content: center;
        align-items: center;
    }

    iframe{
        width:100%;
        height:100%;
        border:0px solid black;
    }
</style>
<!--
<iframe src="/static/tmp.html" width="100%" height="100%" frameborder="0">
-->
<iframe srcdoc="{{data}}">
</iframe>
{% include "tail.html" %}
stock.py
請注意,經由plotly-express分析後的html檔案,一定要儲存在 static指定的目錄中,才可被 iframe 的src 引用。
若是使用 iframe 的srcdoc,則需傳入 fig.to_html() 所產生的html 字串。此種方式在記憶体中運作,不用存檔到硬碟中,所以效能當然會快很多。
import pandas as pd
from django.shortcuts import render
import mysql.connector as mysql
import plotly_express as px
import plotly
import plotly.graph_objects as go
import numpy as np
def html(request):
    conn=mysql.connect(host='ip', user='帳號', password='密碼', database='資料庫')
    cursor=conn.cursor()
    cmd="select * from taiex where tx_date>='2021-01-01' order by tx_date"
    cursor.execute(cmd)
    rs=cursor.fetchall()
    cursor.close()
    conn.close()
    ls=[]
    for r in rs:
        ls.append(r)
    cols=['id', '日期','openning','highest','lowest','收盤價']
    df=pd.DataFrame(ls, columns=cols)
    #fig=px.line(df, x='日期', y='收盤價', title='台灣股市')
    fig=go.Figure()
    fig.add_trace(go.Scatter(x=df['日期'], y=df['收盤價'], name='收盤價', line = dict(color='blue', width=2), showlegend=False))
    x=list(range(len(rs)))
    f=np.poly1d(np.polyfit(x, df['收盤價'], 10))
    reg=f(x)
    fig.add_trace(go.Scatter(x=df['日期'], y=reg,name='日k線', line=dict(color='red', width=2)))
    data=fig.to_html(include_plotlyjs='cdn')
    return render(request, 'stock.html', {'data':data})
home.html
{% include "head.html" %}
<style>
    div{
        display: flex;
        justify-content: center;
        align-items: center;
    }
</style>
<div>
    <img src="/static/images/DSCN4327.JPG" width="640" height="480"/>
</div>
{% include "tail.html" %}