機器學習與深度學習
深度學習是屬於機器學習其中一個分支,深度學習不需要輸入特徵,會自已去找特徵。
不過此房價預測範例必需輸入特徵,所以不屬於深度學習範圍。那為何把此專案例入深度學習呢??
在此必需承認一件事,前面的 AI人工智慧 章節混合了 “非深度學習” 及 “深度學習” 的課程。如今新增了深度學習的課程,所以必需強加區隔。在以往的 AI人工智慧 並未介紹如何由特徵進行分析,所以由此開始介紹。
波士頓房價預測
盡管我們對房價不是那麼的關心 (就買不起咩),更何況這是波士頓的房價狀況。但這一道題目是許多機器學習者的起手式,介紹了資料處理的詳細步驟,所以必需耐心理解。
心理準備
每個人都希望藉由 AI 來精準預測結果,這是外行人的想法,說的更難聽一點,這是腦殘人的想法。
房價會依賣方的心情(吸毒急需錢,戰爭要移民……..),買方的心情(財力,需求…….),通膨,物價指數,有上千萬種因素。而且房價不是用斤兩來秤的,也不是一斤多少錢有絕對的標準,所以別再問為什麼預測的房價不一樣(或不準),因為這只是一個大略的範圍而以。
安裝套件
請先安裝如下套件。
pip install scikit-learn matplotlib seaborn
載入資料
波士頓房價資料請由本網站下載 : boston.xlsx。然後使用如下代碼載入資料
import pandas as pd
display=pd.options.display
display.max_columns=None
display.max_rows=None
display.width=None
display.max_colwidth=None
df=pd.read_excel("boston.xlsx", sheet_name='Sheet1',index_col=0, keep_default_na=False)
print(df)
結果如下
     PRICE      CRIM     ZN  INDUS  CHAS     NOX     RM    AGE      DIS   RAD    TAX  PTRATIO       B  LSTAT
0     24.0   0.00632   18.0   2.31   0.0  0.5380  6.575   65.2   4.0900   1.0  296.0     15.3  396.90   4.98
1     21.6   0.02731    0.0   7.07   0.0  0.4690  6.421   78.9   4.9671   2.0  242.0     17.8  396.90   9.14
2     34.7   0.02729    0.0   7.07   0.0  0.4690  7.185   61.1   4.9671   2.0  242.0     17.8  392.83   4.03
3     33.4   0.03237    0.0   2.18   0.0  0.4580  6.998   45.8   6.0622   3.0  222.0     18.7  394.63   2.94
4     36.2   0.06905    0.0   2.18   0.0  0.4580  7.147   54.2   6.0622   3.0  222.0     18.7  396.90   5.33
5     28.7   0.02985    0.0   2.18   0.0  0.4580  6.430   58.7   6.0622   3.0  222.0     18.7  394.12   5.21
....................................
共有506筆資料,13個特徵。PRICE 為房價,RM 為每棟房子的房間數,LSTAT(中低收入戶在此處的人口比例)。詳細欄位說明如下
CRIM     per capita crime rate by town
ZN       proportion of residential land zoned for lots over 25,000 sq.ft.
INDUS    proportion of non-retail business acres per town
CHAS     Charles River dummy variable (= 1 if tract bounds river; 0 otherwise)
NOX      nitric oxides concentration (parts per 10 million)
RM       average number of rooms per dwelling
AGE      proportion of owner-occupied units built prior to 1940
DIS      weighted distances to five Boston employment centres
RAD      index of accessibility to radial highways
TAX      full-value property-tax rate per $10,000
PTRATIO  pupil-teacher ratio by town
B        1000(Bk - 0.63)^2 where Bk is the proportion of black people by town
LSTAT    % lower status of the population
MEDV     Median value of owner-occupied homes in $1000's
EDA(Explorator Data Analysis)
資料分析探索 (Explorator Data Analysis) 是讓我們對收集到的資料有充分的了解。包含了
房價分佈 : 每個房價的分佈圖
相關特徵 : 那些事情 (特徵) 對房價的影響特別力害,
無關特徵 : 那些事情 (特徵) 對房價沒啥影響。
房價分佈
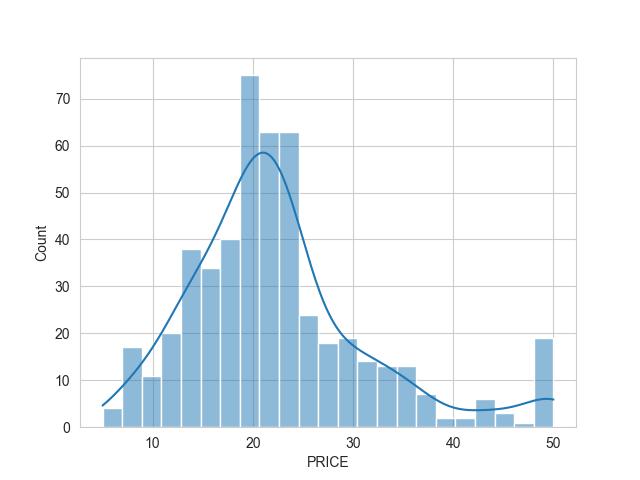
底下使用 sns顯示 df[‘PRICE’] ,也就是顯示每一間房屋的價格分佈
import seaborn as sns
import pylab as plt
sns.set_style('whitegrid')
sns.histplot(df['PRICE'], kde=True)
plt.show()

上述的海生圖,有點偏向左邊,右邊的豪宅比較稀疏,這就會影響我們預測的準度。
為什麼會影響呢? 試想一下,郭台銘一個人拉高了多少我們的國民平均所得。這種貧富愈不均的情形下,預測就會愈不準確。所以後續章節會討論如何把最高值往右拉到整個圖的中心。
皮爾森積差-Pearson
皮爾森積差(perason) 是將每個特徵與其它特徵進行計算,計算後的值介於 -1~1之間。0 表示沒有任何相關性,接近 -1 或 1 則表示相關性非強常。
皮爾森積差的公式為 $(r=\frac{\sum_{i=1}^{n}(X_i-\overline{X})(Y_i-\overline{Y})}{\sqrt{\sum_{i=1}^{n}(X_i-\overline{X})^2}\sqrt{\sum_{i=1}^{n}(Y_i-\overline{Y})^2}})$
二個變數量 X , Y。 $(\overline{X})$為 X 的平均數, $(\overline{Y})$為 Y 的平均數。
$(\sum_{i=1}^{n}(X_i-\overline{X})(Y_i-\overline{Y}))$ 稱為共變異數,又稱為協方差(Convariance)
$(\sqrt{\sum_{i=1}^{n}(X_i-\overline{X})^2})$ 為 X 的標準差(standard deviation)。
協方差 / (X 標準差 * Y 標準差),就是皮爾森積差。
底下代碼手動使用Python代碼計算皮爾森積差
import numpy as np
np.random.seed(1)
#x', y'為x, y的平均數
#(x0-x')(y0-y')+(x1-x')(y1-y')+(x2-x')(y2-y')+...+(xn-x')(yn-y')
x=np.random.randint(1, 100, 10)
y=np.random.randint(1, 100, 10)
xmean=x.mean()
ymean=y.mean()
print("x:",x)
print("y:",y)
print("x_mean:",xmean)
print("y_mean:",ymean)
#共異變數/斜方差Convariance =>(38-38)*(77-39.9)+(13-38)*(72-39.9)+.....+(2-38)*(29-39.9))
convariance=np.sum((x-xmean)*(y-ymean))
print(f'斜方差 : {convariance}')
xd=np.sqrt(np.square(x-xmean).sum())
yd=np.sqrt(np.square(y-ymean).sum())
#皮爾森積差其值一定會介於 -1~1之間
p=convariance/(xd*yd)
print(f"皮爾森積差 : {p}")
import pandas as pd
df=pd.DataFrame(data={"x":x, "y":y})
print(f'df自動計算皮爾森積差 : \n{df.corr()}')
結果 :
x: [38 13 73 10 76  6 80 65 17  2]
y: [77 72  7 26 51 21 19 85 12 29]
x_mean: 38.0
y_mean: 39.9
斜方差 : 779.9999999999998
皮爾森積差 : 0.09304301976479494
df自動計算皮爾森積差 :
          x         y
x  1.000000  0.093043
y  0.093043  1.000000
為什麼皮爾森積差接近 -1 及 1 時相關性非常強呢? 這個是很深的數學原理,有興趣的人可上網 google一下。
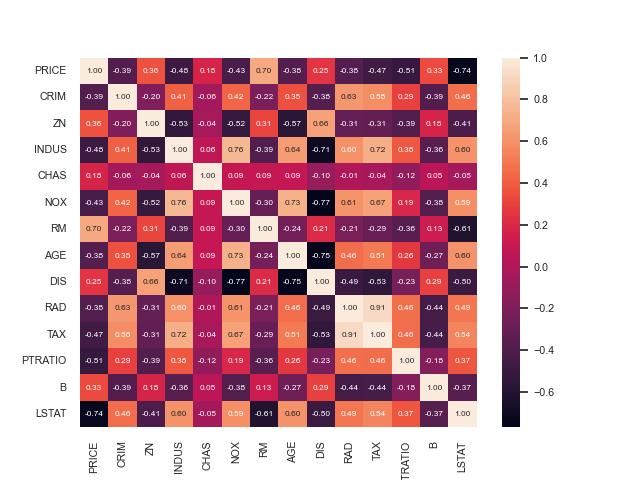
因為皮爾森積差常被拿來運用,每次都要寫上述的程式非常麻煩。所以 DataFrame 開發了 corr 方法計算皮爾遜積差。但皮爾森系數只是一堆數字,人類是無法理解的,所以總是使用熱度圖來視覺化皮爾森積差。
from sklearn.datasets import load_boston
import seaborn as sns
import pylab as plt
import pandas as pd

boston_dataset = load_boston()
print(boston_dataset.data.shape)
df=pd.DataFrame(data=boston_dataset.data, columns=boston_dataset.feature_names)
df.insert(0, column="PRICE", value=boston_dataset.target)
corrmat=df.corr()
sns.set(font_scale=0.7)
sns.heatmap(corrmat, annot=True, annot_kws={'size':6}, fmt='.2f')
plt.savefig("boston_3.jpg")
plt.show()

上圖,可以看出PRICE(售價)與RM(房子的房間數)及LSTAT(中低收入戶在此處的人口比例)有著極強的關係。中間的對角線是自已本身跟自已的內差,所以一定是1。
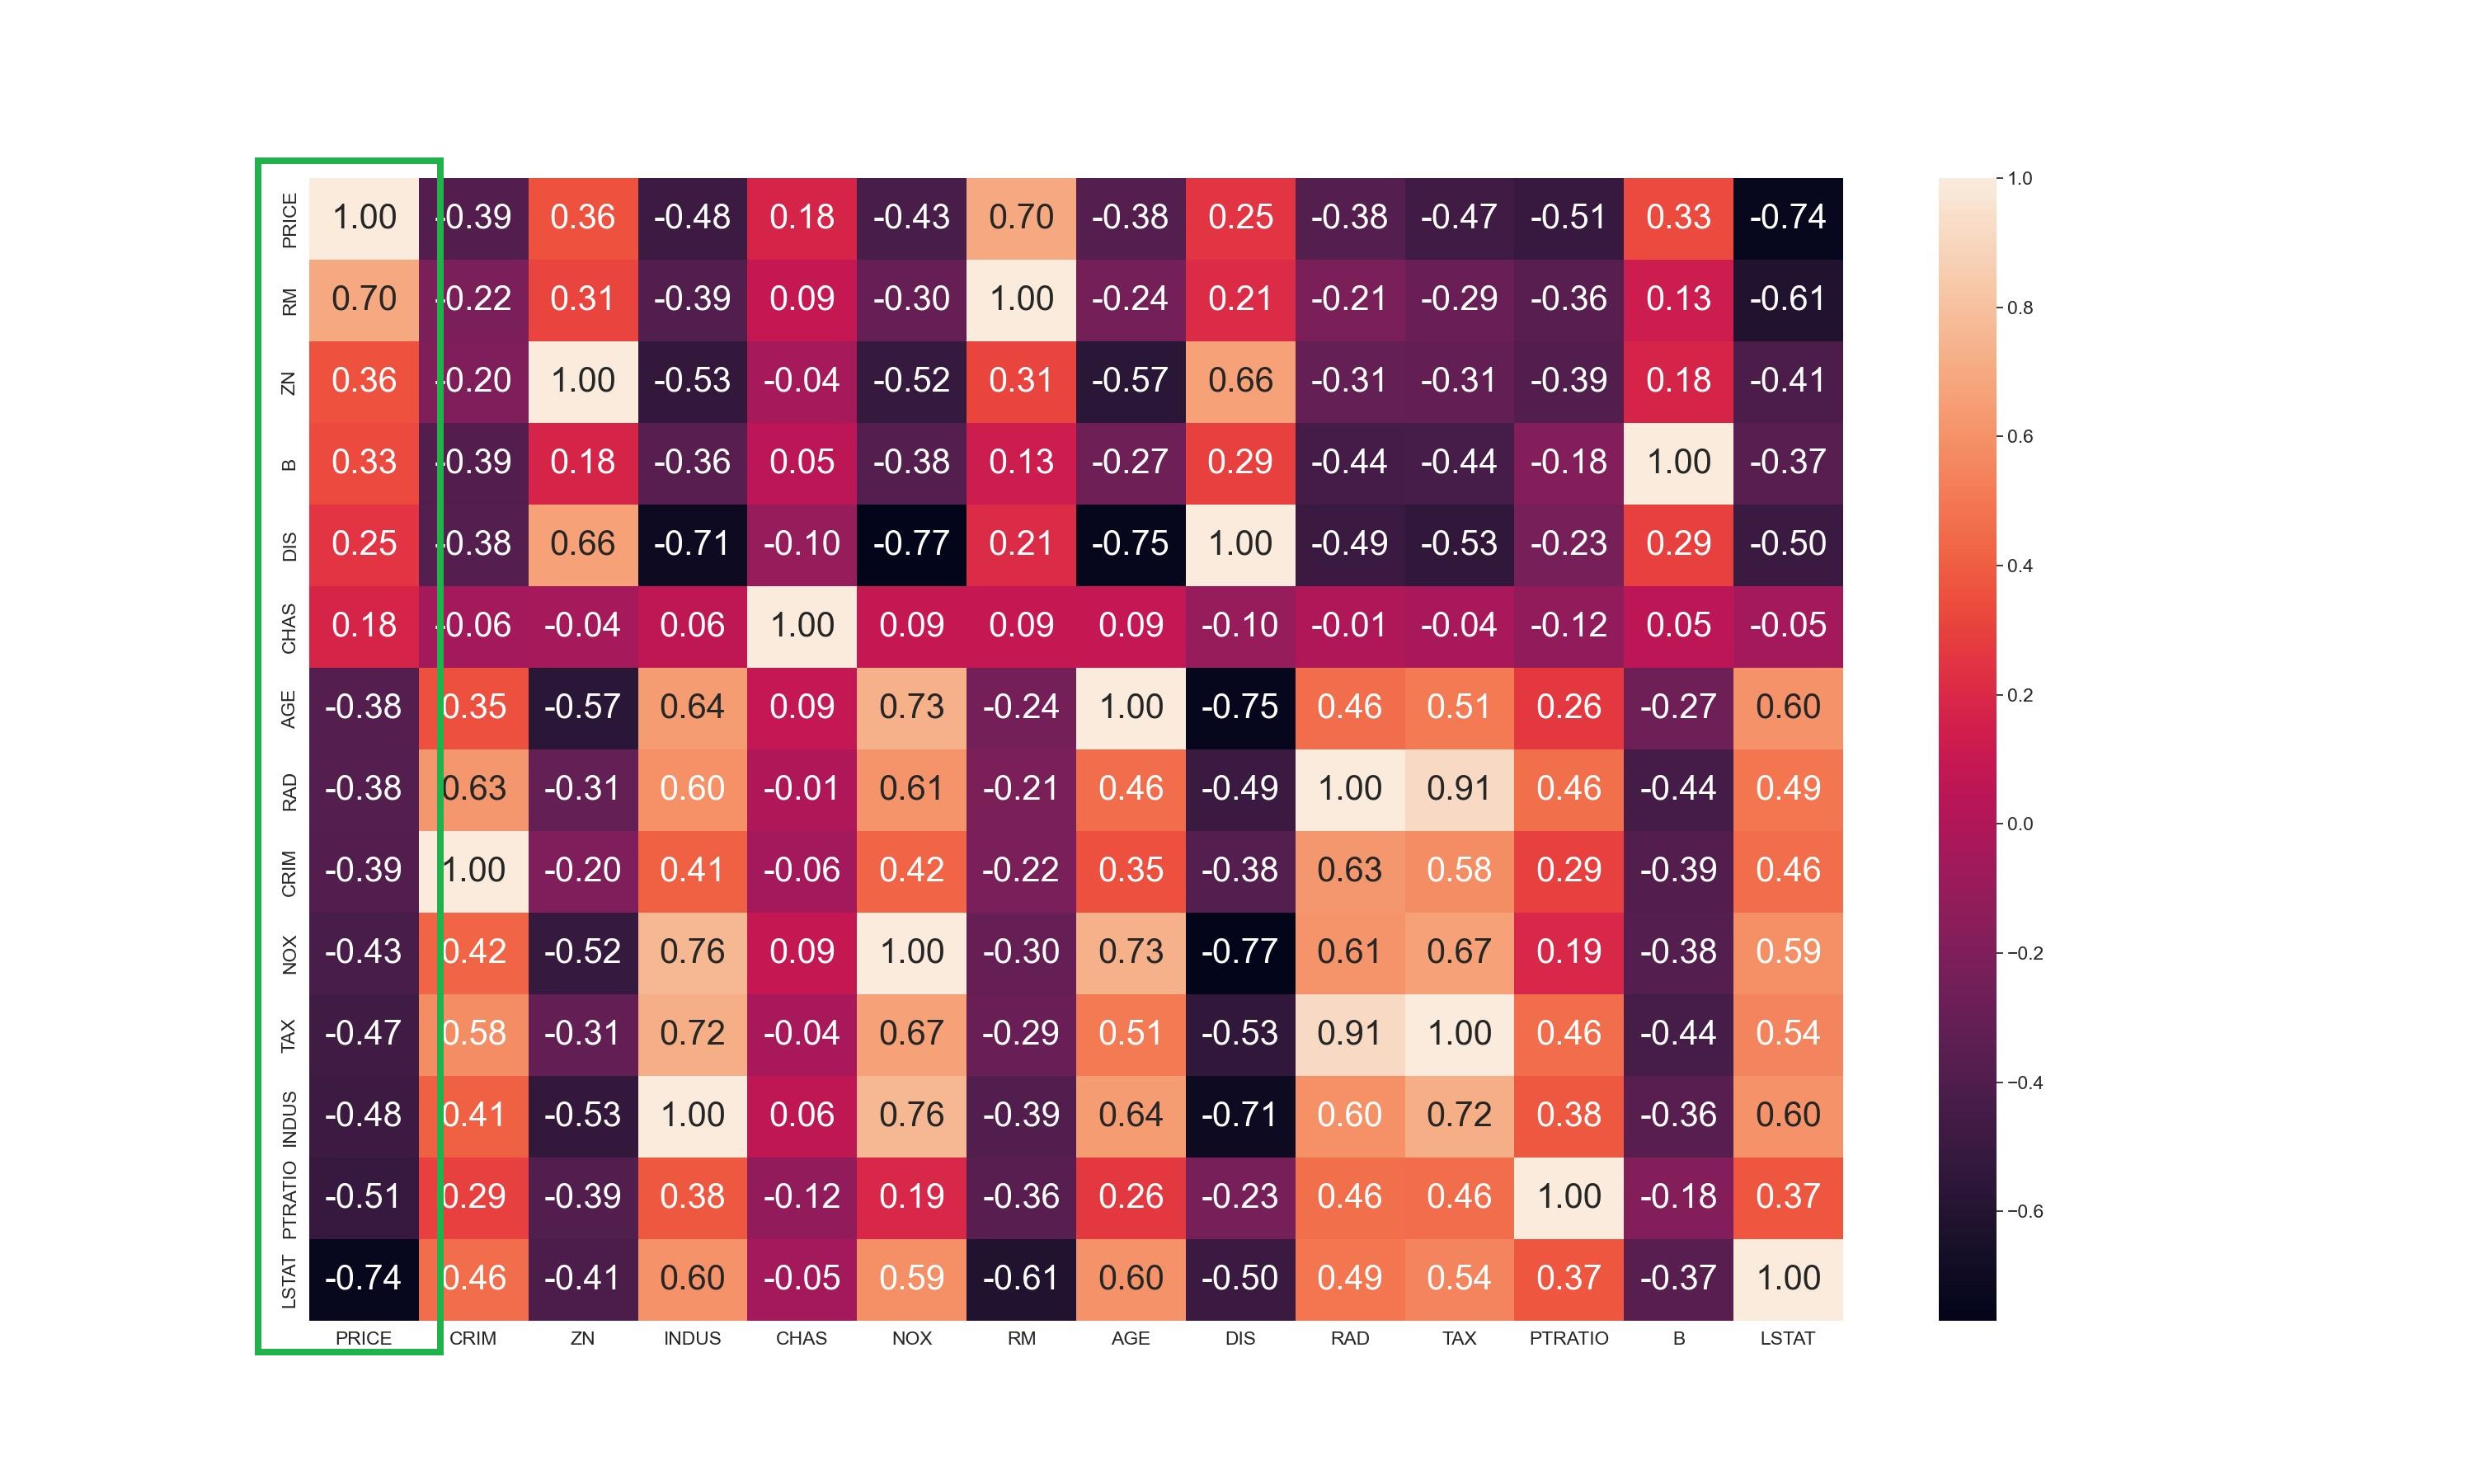
為了更清楚表示,使用 corrmat.nlargest()對 ‘PRICE’ 欄位由大到小進行排序
import seaborn as sns
import pylab as plt
corrmat=df.corr()
corrmat=corrmat.nlargest(len(corrmat), columns='PRICE')
sns.set(font_scale=0.7)
sns.heatmap(corrmat, annot=True, annot_kws={'size':6}, fmt='.2f')
plt.savefig("boston_4.jpg")
plt.show()

一經排序,當然對角線就不是1.0了。
房價與RM/LSTAT關係圖
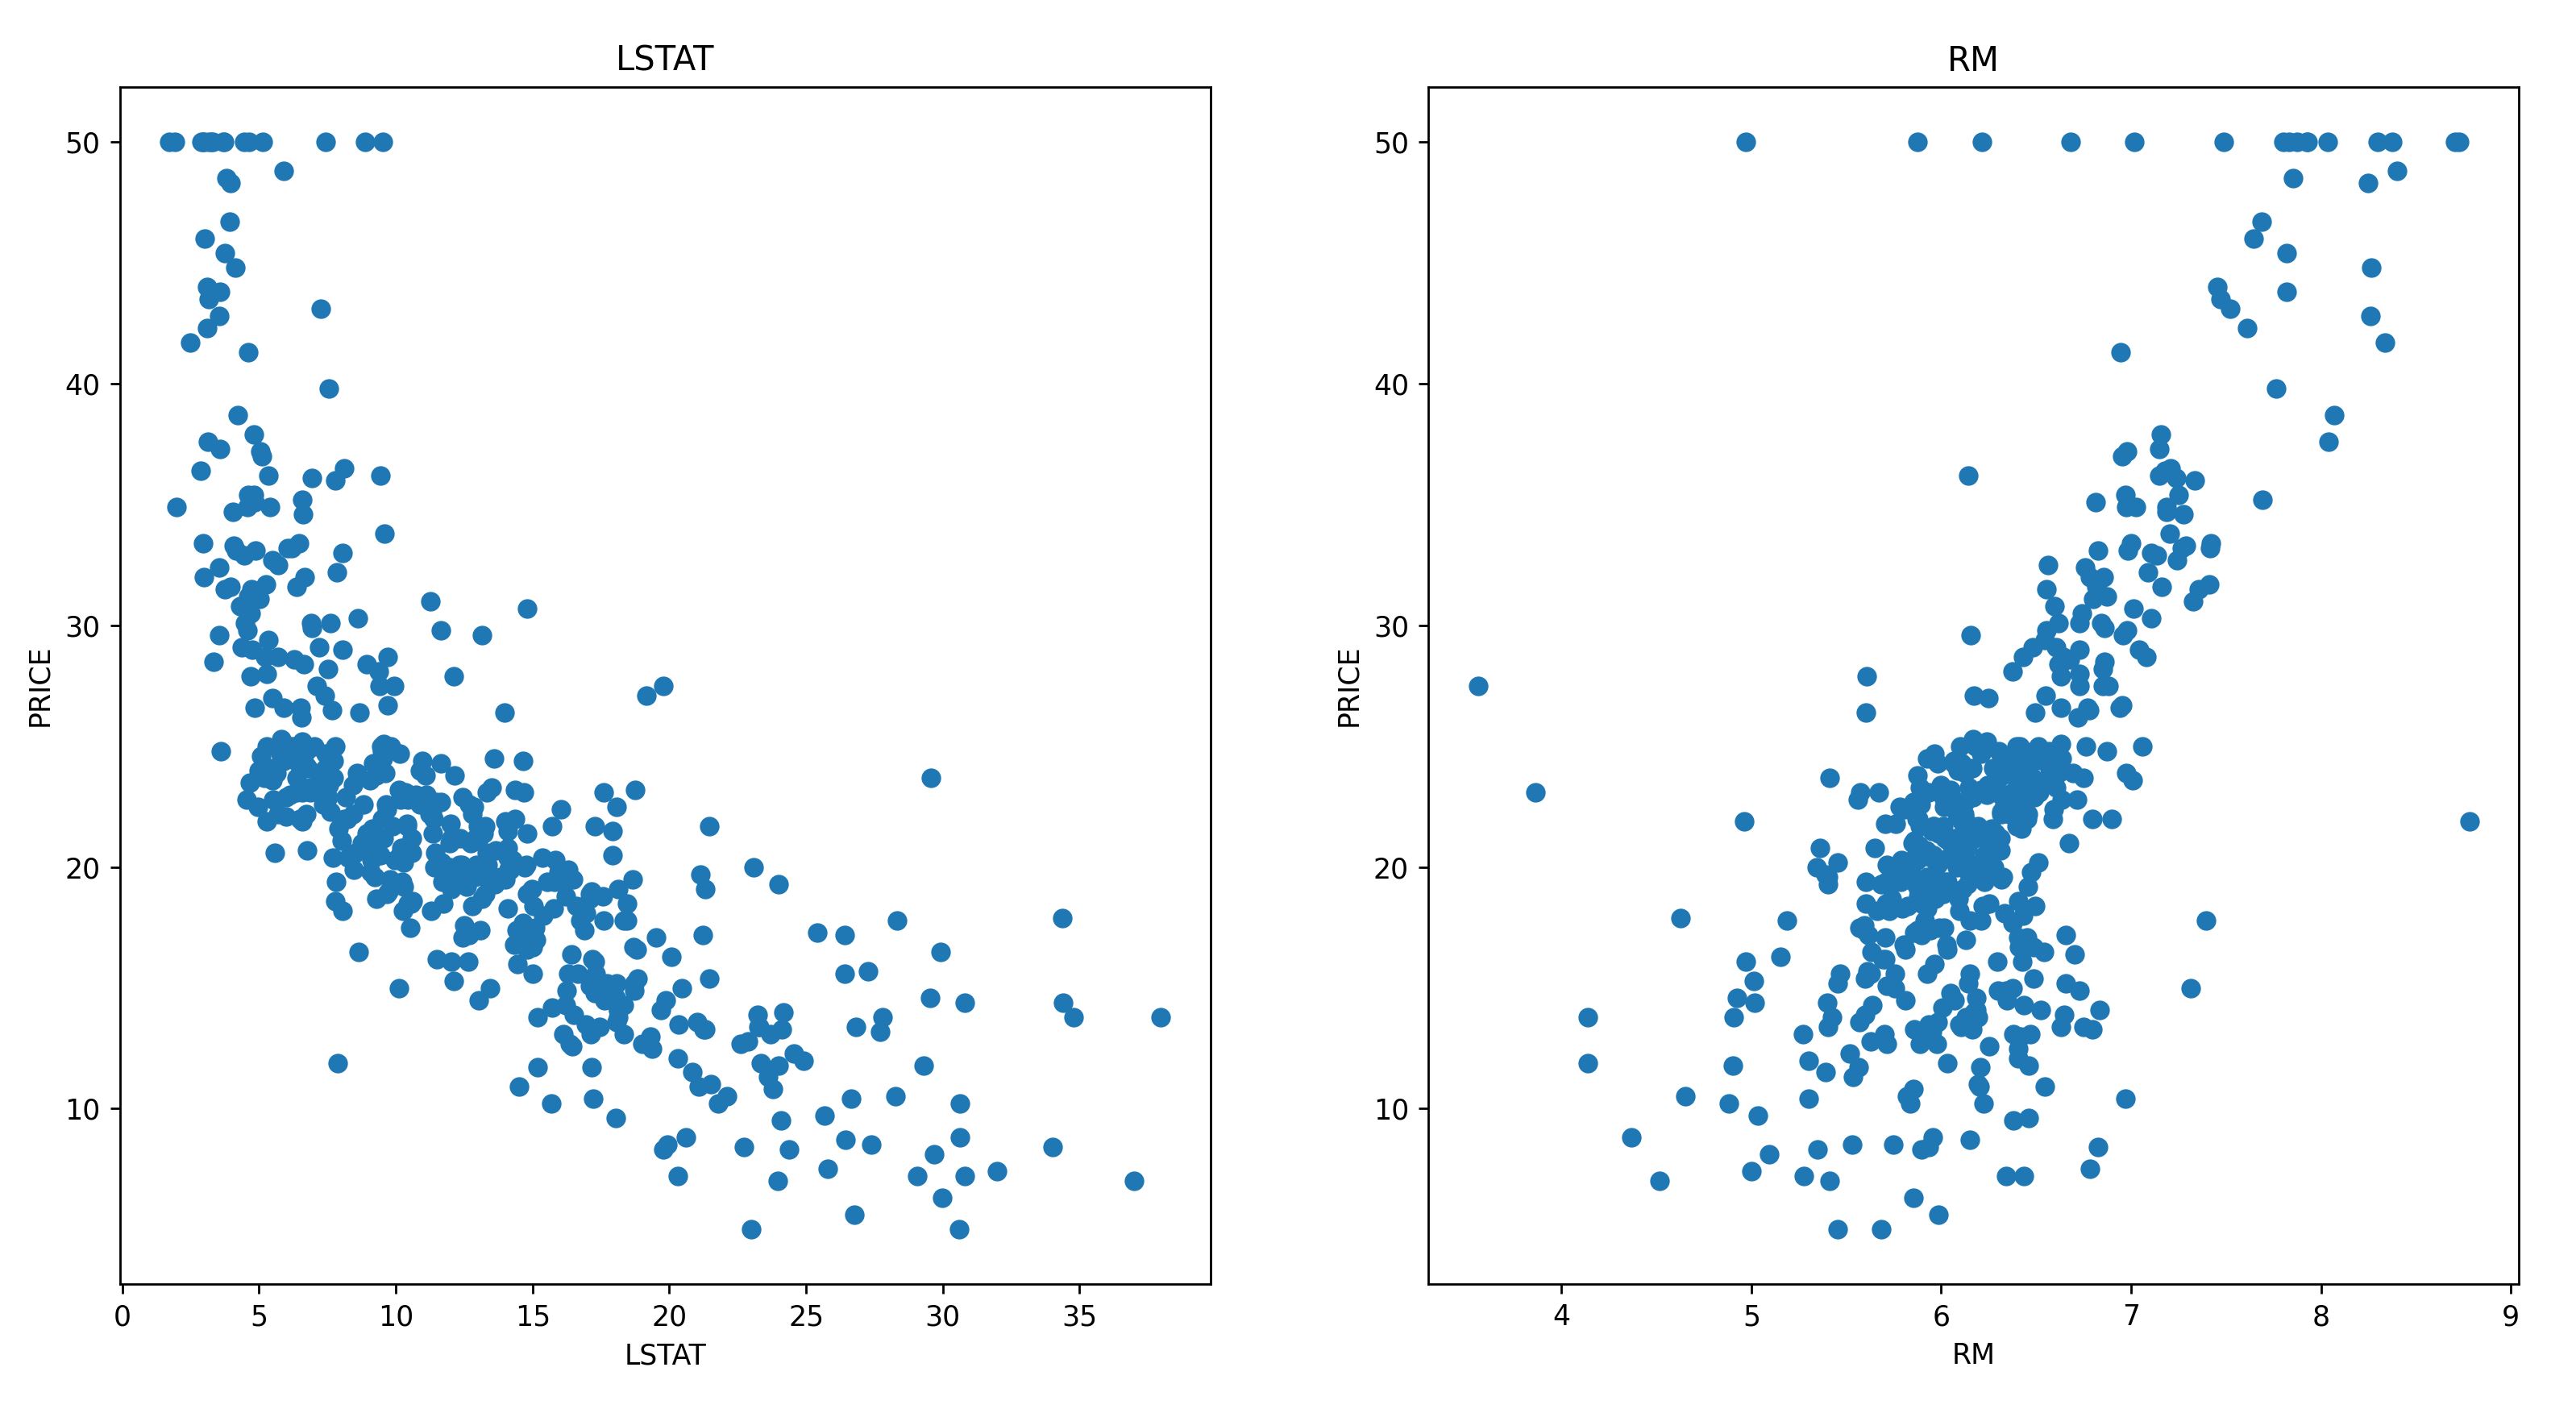
底下代碼可以看到房價跟 LSTAT (中低收入戶佔當地居住人口的比例) 呈現反向的線性關係,而房價與RM (每間房子的房間數) 呈現正向的線性關係。
import pylab as plt
features=['LSTAT','RM']
plt.figure(figsize=(20,5))
for i, col in enumerate(features):
    plt.subplot(1, len(features), i+1)
    x=df[col]
    y=df['PRICE']
    plt.scatter(x, y)
    plt.title(col)
    plt.xlabel(col)
    plt.ylabel('PRICE')
plt.show()

特徵工程
在EDA之後,還需進行特徵工程,填入空值,並將離群值刪除。本例尚不需這麼麻煩,所以跳過。
詳細說明請參考本人撰寫的 Skewness 說明
建立訓練模型
先將 LSTAT 及 RM 合併成x 軸的二個特徵,y軸為房價,再使用 train_test_split 將資料分成 80%的訓練資料及 20% 的測試資料。
LSTAT 及 RM 合併使用 np.c_[] 欄合併,np.c_的用法如下
import numpy as np
a=[1,2,3,4]
b=[5,6,7,8]
c=np.c_[a,b]
print(c)
結果:
[[1 5]
 [2 6]
 [3 7]
 [4 8]]
最後建立線性回歸模型,開始訓練。
import numpy as np
from sklearn.model_selection import train_test_split
from sklearn.linear_model import LinearRegression
data=np.c_[df['LSTAT'], df['RM']]
x=pd.DataFrame(data=data, columns=['LSTAT','RM'])
y=df['PRICE']
x_train, x_test, y_train, y_test = train_test_split(x, y, test_size = 0.2, random_state=5)
model=LinearRegression()
#開始訓練
model.fit(x_train, y_train)
預測
底下的 model.score,會使用 x_test的測試資料進行預測房價,然後再跟實際的 y_test房價進行評分。分數若能達到 1.0 當然是最準確,此例可以達到 0.66289 已經是非常的高了。
若只需預測,只需使用 model.predict即可。底下將實際房價 y_test 與 預測值 y_pred zip在一起,方便觀查之間的差異。
#底下的model.score, 會使用 x_test的資料進行預測房價,
#再將預測的房價與實際的 y_test房價進行評分
print(f'score:{model.score(x_test, y_test)}')#0.6628996975186952

#底下僅進行預測,將預測與實際合併再一起進行觀測
y_pred=model.predict(x_test)
for i in zip(y_pred, y_test):
    print(i)
結果:
score:0.6628996975186952
(37.38999403450201, 37.6)
(29.79290610929409, 27.9)
(25.86755297466814, 22.6)
(0.31370828082136093, 13.8)
(33.313855585417315, 35.2)
模型訓練及儲存.py
底下是讀取資料,建模,訓練的完整代碼
import pickle
import pandas as pd
import numpy as np
from sklearn.model_selection import train_test_split
from sklearn.linear_model import LinearRegression

display=pd.options.display
display.max_columns=None
display.max_rows=None
display.width=None
display.max_colwidth=None
df=pd.read_excel("boston.xlsx", sheet_name='Sheet1',index_col=0, keep_default_na=False)
data=np.c_[df['LSTAT'], df['RM']]
x=pd.DataFrame(data=data, columns=['LSTAT','RM'])
y=df['PRICE']
x_train, x_test, y_train, y_test = train_test_split(x, y, test_size = 0.2, random_state=5)
model=LinearRegression()
#開始訓練
model.fit(x_train, y_train)
pickle.dump(model, open("house.model", "wb"))
模型載入及預測.py
底下是載入模型,預測的完整代碼
import pickle
import pandas as pd
import numpy as np
from sklearn.model_selection import train_test_split

display=pd.options.display
display.max_columns=None
display.max_rows=None
display.width=None
display.max_colwidth=None
df=pd.read_excel("boston.xlsx", sheet_name='Sheet1',index_col=0, keep_default_na=False)

data=np.c_[df['LSTAT'],df['RM']]
x=pd.DataFrame(data=data, columns=['LSTAT','RM'])
y=df['PRICE']
x_train, x_test, y_train, y_test=train_test_split(x,y, test_size=0.2, random_state=5)

#模型載入及預測
model=pickle.load(open("house.model",'rb'))
score=model.score(x_test, y_test)
print(score)#不是精準度,而是信心度
#predict : 開始預測
pre_price=model.predict(x_test)
for i in zip(pre_price, y_test):
    print(i)
